Kentucky Center for Economic Policy: A Time To Invest: Preview of the 2022–2024 Budget of the Commonwealth

By KCEP STAFF: ASHLEY SPALDING, PAM THOMAS, DUSTIN PUGEL, JASON BAILEY and ANNA BAUMANN
The General Assembly faces a critically important opportunity with the 2022–2024 Budget of the Commonwealth. The state has a historic budget surplus and unspent federal aid that provide the resources needed to prevent hardship for Kentuckians in the resurging pandemic, support a robust and equitable recovery and begin reinvesting in education, health, social services and other critical investments after more than a decade of state budget cuts. These monies give Kentucky the chance to begin charting a better course.
Click here for the report in PDF form.
More On Budget & Tax: KyPolicy Releases Comprehensive Preview of the 2022-2024 Budget of the Commonwealth
The Budget of the Commonwealth reflects Kentucky’s values and priorities. Adequately, equitably funded schools would mean all Kentucky children, regardless of their zip code, could receive a high-quality education. Well-resourced supports for the elderly, children and people with disabilities would help families thrive. Less spending on incarceration, and more on mental health, infrastructure and college affordability, would enhance the well-being of individuals, families and communities. These kinds of policy choices remove barriers to opportunity and security that people face because of race, gender, wealth and the part of the state where they live, and support the economic potential of all people and communities. They also create a state where people want to live, raise a family, work and do business.
Unfortunately, Kentucky falls short because of budget austerity that has limited investment in essential public goods and services needed to support thriving communities. As a policy document, the budget should be read along with Kentucky’s Tax Expenditure Analysis, which summarizes various tax credits, deductions, carve-outs and other breaks that reduce the revenue flowing into the budget. It, too, is a reflection of Kentucky’s values and priorities. A trend toward spending through the tax code on breaks for special interests, rather than appropriations that benefit everyone, is key context for Kentucky’s historic budget challenges — and the current opportunity to choose differently.
Federal COVID relief to the state and to individuals has directly and indirectly benefitted the budget, creating a historic opportunity to strengthen Kentucky communities. For a state struggling in the ongoing COVID pandemic and recession, and that had not yet begun to reinvest from budget cuts made after the Great Recession, investing a significant portion of these resources now in critical areas will put Kentucky on the path to a more prosperous and equitable future. It is the first step in returning to sound economic and fiscal policy.
This report describes in detail the surplus opportunity and the imperative to reinvest in Kentucky. It describes the condition of the budget across different areas of government in the context of historical state funding levels and impacts, as well as federal relief monies that are alleviating the strain. And it warns against giving away the surplus on more tax cuts for the wealthy and corporations at the expense of investments Kentucky needs to thrive.
Kentucky has a historic opportunity to invest
Thanks to federal aid, revenues have held up during the pandemic
When the COVID-19 pandemic hit the economy, states like Kentucky expected tax revenues to plummet. But thanks to robust federal aid provided to individuals, businesses and state and local governments through the CARES Act, the American Rescue Plan Act of 2021 (ARPA) and other relief packages, Kentucky never experienced a decline in receipts. State revenues have held up strongly during the pandemic, resulting in a historic revenue surplus at the close of Fiscal Year (FY) 2021. Overall, General Fund receipts grew by 10.9% in FY 2021, which was the highest annual growth rate in 26 years, and actual revenues exceeded the estimate by more than $1.1 billion — the highest in Kentucky’s history.1
Federal aid has propped up the economy when it was needed most, directly boosting household incomes through measures like stimulus checks, expanded unemployment benefits and increased food aid to individuals, along with direct payments to businesses through the Payroll Protection Program and other supports. These actions allowed individuals to keep spending and businesses to keep operating, resulting in sales and income tax receipts that were far greater than initially anticipated, and that continue to exceed estimates. In addition, federal assistance to state and local governments allowed them to keep public employees on the payroll and to offset the costs of addressing the pandemic, circulating more money into the economy and further helping to support tax receipts.
The primary drivers of Kentucky’s General Fund growth in 2021 were the individual income tax, the sales and use tax, and corporate taxes, which combined generated $10.6 billion in 2021 or 82.5% of total General Fund revenue.2
- Sales tax receipts grew 12% in FY 2021, which was the largest increase since the rate was increased from 5% to 6% in 1990. Collections from online retailers exceeded $270 million.3 The trend continues in FY 2022, with receipts expected to be up by 8.5% by the close of FY 22.4
- Individual income tax receipts were up by $379 million year over year in 2021 — a 7.9% increase from FY 2020.5 Individual income tax receipts are expected to be up another 5.5% by the close of FY 22.6
- Business taxes, which include the corporate income tax and the limited liability entity tax (LLET) finished FY 2021 up 38.1% compared to 2020 with $335 million more in revenue than was projected.7 By the close of FY 22, business tax receipts are projected to be up 9.9%.8
- Real property tax growth was 4.4% in 2021 — the highest in 14 years. The assessment base increased by 6.5%, resulting in a reduction in the state property tax rate from 12.2 cents per $100 of assessed value to 11.9 cents per $100 of assessed value.9 In addition, tangible property receipts grew by 15.9%, driven by an increase of 23.2% in motor vehicle tax collections for an overall increase in property tax receipts of 9.3%.10
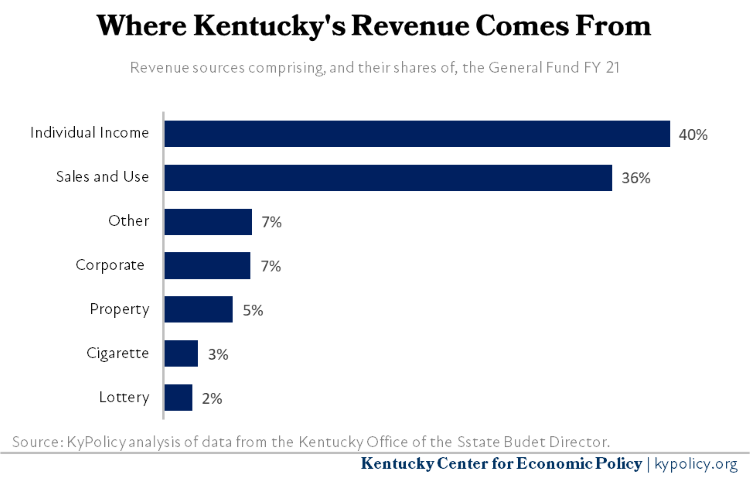 GENERAL FUND REVENUE SOURCES FY21
Forecast predicts robust revenues available this biennium
The previously enacted General Fund estimate for FY 2022 is $11.8 billion, which is 7.6% less than actual receipts in FY 2021, and takes into account over $161 million in tax cuts enacted by the 2021 General Assembly.11 Yet revenues are expected to exceed that amount by a considerable margin. The official revenue estimate from the CFG for the upcoming biennium issued in December 2022 revises the revenue estimate for the current fiscal year, and provides estimates for the 2022–2024 biennium. Based on continuing robust receipts in the individual income tax, sales tax and business taxes, the CFG increased the estimate for the current fiscal year by $1.94 billion — 16% greater than the estimate the current year budget was based on.12 The revised current year estimate projects 7.5% year over year growth between FY 21 and 22, including a one-time legal settlement payment of $225 million from Flutter Entertainment, the parent company of PokerStars. Without the settlement included, growth is projected to be 5.8%.13
For the 2022–2024 biennium, the CFG anticipates more moderate growth of 2.1% in 2023 and 4.2% in 2024, producing $294 million in new revenues in 2023 and $598 million in 2024.14 The forecast reverts back to the moderate revenue growth patterns experienced by Kentucky over the past several years because it does not assume passage of the Build Back Better Act at the federal level, and therefore does not include the economic stimulus anticipated by passage of that Act, which would positively influence state revenue receipts.
Strong receipts have created an ample rainy day fund, with available resources for the 2022-24 budget
All but $10 million of the FY 2021 surplus was deposited into the Budget Reserve Trust Fund (BRTF), also known as the state’s rainy day fund.15 Even after funds were taken out to subsidize battery plants during a fall special session, the balance in the fund was still $1.5 billion, equal to 12.4% of General Fund appropriations. For context, prior to 2021, the balance of the BRTF had never exceeded 3.7% of General Fund appropriations.16 As a result, Kentucky enters the 2022 budget session in an unfamiliar situation with a historic balance in the BRTF and additional revenues of $1.94 billion over the enacted estimate projected for the 2022 fiscal year. That results in $3.4 billion in extra resources available for the budget, an amount equal to 28.4% of annual spending, as shown in the graph below.
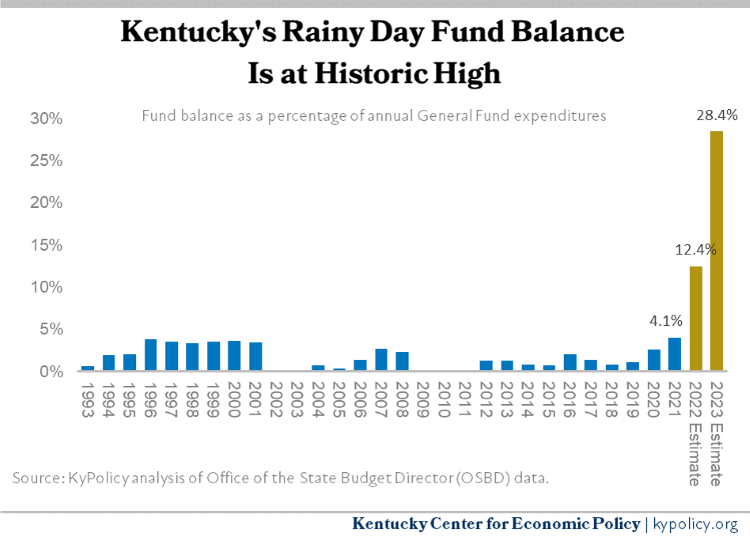 RAINY DAY FUND BALANCE AS PERCENTAGE OF GENERAL FUND EXPENDITURES
The purpose of the BRTF is to help finance public services during economic downturns or other external shocks, when state revenues typically decline or grow more slowly.17 Rainy day funds play a critical role in helping states recover from recessions by providing the resources necessary for governments to continue spending, injecting resources that circulate through communities, sustaining jobs, supporting businesses and reducing harm that would otherwise occur. Credit rating agencies support using rainy day funds during downturns, and building them up during good times.18 Historically, Kentucky has not made sufficient contributions to its rainy day fund and has on occasion drawn down the fund when the economy was strong.19
Until now, Kentucky has never had what is considered a sufficient balance in the BRTF.20 But because of the surpluses, the balance will be much larger than is necessary to prepare for future economic downturns, presenting a historic opportunity for the General Assembly to accomplish three important goals. First, it means resources are available to help Kentucky families that continue to struggle because of the pandemic. Second, it means the General Assembly can begin reversing the 19 rounds of budget cuts made since 2008, which have reduced state expenditures by $2.3 billion. And third, it allows the commonwealth to leave an adequate amount in the BRTF to begin preparing for the next recession.21
Additional federal monies are also available this budget session
While federal aid has played an important role in boosting Kentucky’s state tax streams, it has also meant that significant resources are directly available to state and local governments to address pandemic needs. The federal relief distributed directly came primarily through the CARES Act and ARPA, although there were five smaller relief measures passed by Congress between the two larger bills. In total, including all of the federal aid bills and amounts received by all executive branch agencies or that were distributed through an executive branch agency, Kentucky is expected to receive over $16.9 billion.22 Of this amount, $10.1 billion had been expended as of Nov. 30, 2021.23
Under the CARES Act, Kentucky received over $7 billion, with $1.7 billion of that for general COVID relief purposes that could be appropriated by the General Assembly in accordance with federal guidelines.24 Louisville Metro was the only local government that qualified for a direct allocation based on population, and received $134 million.25
Under ARPA, Kentucky has received over $6.7 billion.26 That includes $2.2 billion for state government to be appropriated by the General Assembly, $868 million to counties, $395 million to metro cities, and $314 million to other municipalities through ARPA’s State and Local Fiscal Recovery Fund (there is also ARPA money that goes directly to specific needs like education, child care and rental assistance).27
State and Local Fiscal Recovery Funds can be used for COVID response efforts, to replace lost public-sector revenue, to support immediate economic stabilization, or to address systemic public health and economic challenges. Amounts received through the State and Local Fiscal Recovery Fund are being distributed in two tranches with half already provided in May 2021, and the balance available in May 2022. Governments have until Dec. 31, 2024 to allocate these funds, and during the 2021 legislative session, the General Assembly appropriated $1.1 billion.28 This leaves $1.1 billion from the State Fiscal Recovery Fund left for the General Assembly to appropriate, providing another critical opportunity for the state to provide relief and aid to those most harmed by the pandemic.
Legislature should avoid giving away surplus in tax cuts
The discussion around Kentucky’s budget typically focuses on how the state cannot afford adequate investments in schools, child welfare, public health, libraries and more. But that narrative often excludes the impact of proliferating tax breaks on what we can afford. Even with the boost in revenue from federal COVID relief, Kentucky’s General Fund is currently much smaller as a share of the state economy than it has been in the past.29 If tax revenues had grown in step with growth in our economy, and the General Fund were still the same size relative to personal income as it was in 1991 after the legislature raised revenue to help pay for the Kentucky Education Reform Act (KERA), the state would have $3.3 billion more in recurring revenue to invest in education, health and other services.30
The General Assembly enacted a mostly flat-lined one-year budget in 2021 while at the same time passing more subsidies for corporations through a variety of tax breaks that will further erode the tax base in the future.31 New or expanded corporate tax breaks included an expansion of the film tax credit to $75 million starting in 2023, a significant increase in the cap on the historic preservation tax credit from $6 million to $100 million including a special $6 million carve-out for the Seelbach Hotel in Louisville, and new credits for cryptocurrency mining companies.32 The Office of the State Budget Director (OSBD) estimated the cost of these credits to be $161.5 million in FY 2022 alone, with larger impacts expected in future years.33 And the state has pledged up to $410 million of the surplus in subsidies for two battery production plants to be built by Ford and SK Innovation.34
The recently published 2022–2024 Tax Expenditure Analysis identifies close to $19 billion in total tax expenditures over the 2022–2024 biennium.35 The analysis describes tax expenditures as follows:
“Tax expenditures differ from normal budget expenditures in that normal budget expenditures are explicitly appropriated on an annual or biennial basis as part of the budgetary process. Tax expenditures are approved by the legislature and then become a permanent part of a state’s tax laws until modified by future sessions of the General Assembly. As a result, tax expenditures have a tendency to become an increasingly larger part of state government expenditures without the need for explicit approval by succeeding legislatures.”36
The $19 billion includes over $43 million for refundable credits for the film industry, $388.8 million from the low tax rate on casino-style slot machines, over $100 million for the newly expanded historic preservation tax credit and $23.2 million for cryptocurrency mining, just to name a few. Because of the way tax expenditures work, these programs receive priority funding over everything else that state government provides and pays for, including education, assistance for children and families and other important services. Thus, before the first dollar is spent on any of these critical needs, Hollywood production companies, slot machine operators, real estate developers and cryptocurrency miners get paid. For comparison, the $555 million spent over the biennium on just the tax breaks identified here would pay for a 5% increase in K-12 per pupil base funding, a $2,000 increase in state employee salaries, and textbooks (which currently receive no funding in the budget) with some money left over. These are the priorities established when new tax breaks are enacted session after session.37
To protect revenue going forward — which time-limited federal aid will not continue to prop up as robustly as it has during the pandemic — the legislature should avoid spending the current surplus on more tax cuts, especially income tax giveaways to profitable corporations and wealthy Kentuckians. One of the reasons Kentucky fared better than other states during the recession is that we still have a diverse array of taxes, including corporate and individual income taxes. Kentucky is one of 30 states whose receipts during the four quarters ending in March of this year were greater than the comparable four quarters before the pandemic. Meanwhile, states such as Alaska, North Dakota, Hawaii, Nevada, Texas, Wyoming and West Virginia that rely heavily on taxes from the oil and gas industry and tourism have not fared as well, with revenues down more than 5% over the same period.38 Different taxes respond differently to economic downturns, and having a broad array of revenue streams reliant on different bases helps to reduce the overall harm.
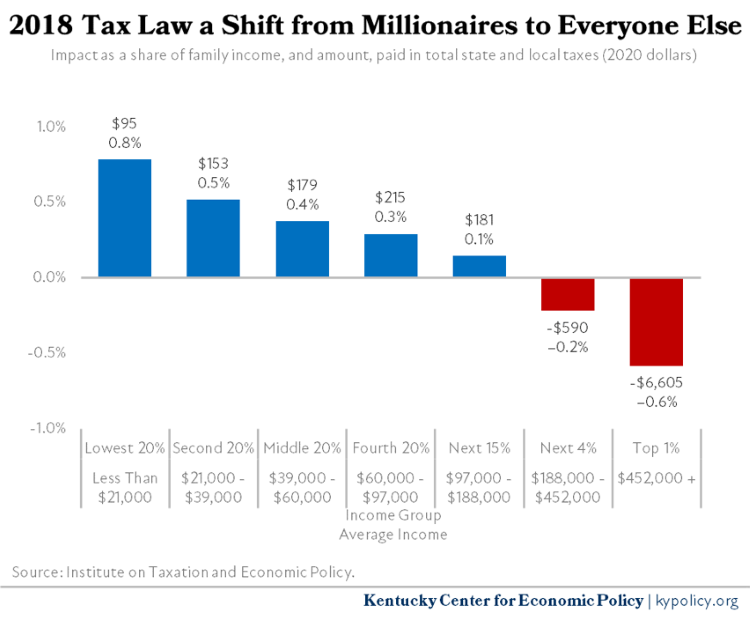
Reductions in income taxes would further erode Kentucky’s tax base, compromising future revenue growth. As with 2018 legislation that replaced Kentucky’s graduated income tax of up to 6% with a flat rate of 5%, and paid in part for the cuts with expanding sales taxes to services like pet grooming and car repair, the people who benefit most from income tax cuts are those with higher incomes. A 2018 analysis by the Institute on Taxation and Economic Policy (ITEP) showed that based on income, the bottom 95% of Kentuckians paid more on average because of the shift from income to sales taxes, while the richest 5% on average received a cut. In 2020 dollars, the richest 1% of Kentuckians, with average incomes of $1.1 million a year, received an average tax cut of $6,605, as illustrated in the graph below.39
 TAXES AS SHARE OF FAMILY INCOME BY INCOME LEVELS
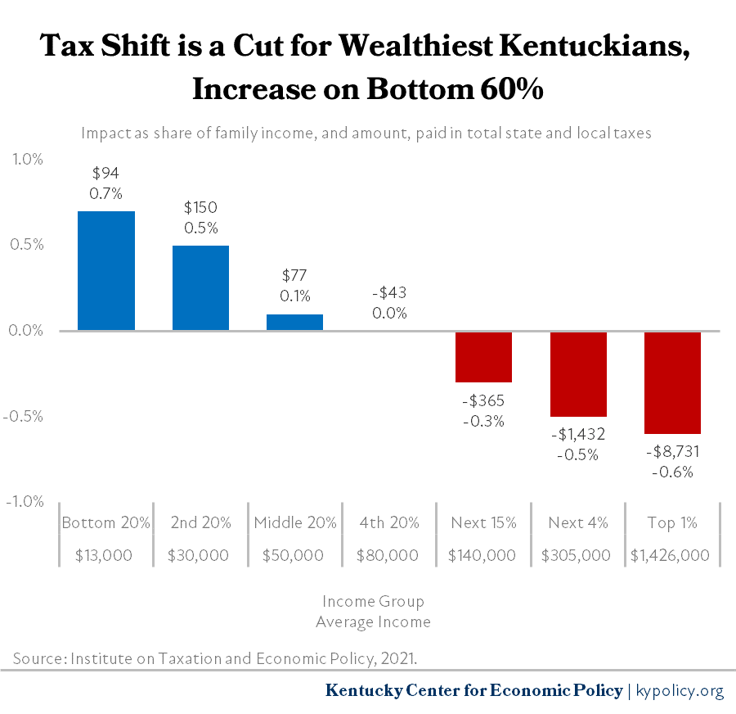
Another analysis from ITEP shows that further reductions in the income tax, for example, from 5% to 4%, would result in the loss of over $1.1 billion in state revenues. For context, this amount is $200 million more a year than Kentucky spends on all of its postsecondary institutions combined — all 8 universities and 16 community colleges where tuition has been steadily rising due to state budget cuts.40 If the lost revenue were made up by raising the sales tax rate, the increase would be from 6% to 7.4%, which would give Kentucky the highest state sales tax rate in the country.41 Further, such a shift would worsen the existing inequalities of who pays taxes, with the bottom 60% of Kentuckians in terms of income paying more in taxes on average, while those with the highest incomes would receive a cut, as shown in the graph below. It would also increase reliance on taxes from Black Kentuckians who have less ability to pay on average due to historic and continuing discriminatory laws and practices. Black Kentuckians already face a higher overall effective tax rate, paying 9.6% of their income on average in state and local taxes compared to 9.4% for white Kentuckians.42
 TAX AMOUNTS PAID BY INCOME LEVELS
Reinvestment in Kentucky through the Budget of the Commonwealth is imperative
The previous section of this report looked at the revenue context for what is possible in the 2022 General Assembly when the legislature crafts the new two-year budget. This section will explore the opportunity and imperative to restore critical areas of the budget that have been deeply underfunded in recent history. In addition to providing an overview of state spending including federal relief funds, the following analysis of the budget gives examples of the compounding impact of a decade or more of cuts and describes the opportunities for reinvestment in the 2022–2024 budget. As context, the chart below illustrates the major ways the state’s General Fund, which totals over $12 billion in 2022, is spent.
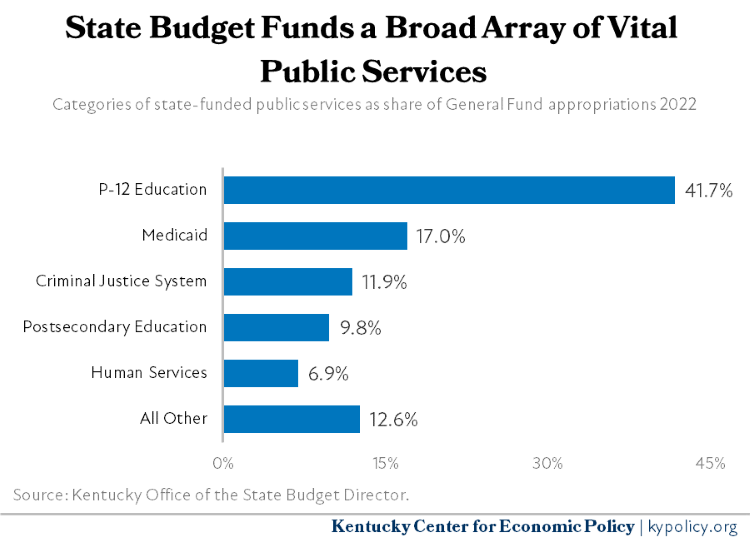 PUBLIC SERVICES SPENDING AS SHARE OF GENERAL FUND 2022
Budgets are typically created in even-numbered years for two years at a time, but due to uncertainties caused by the COVID-19 pandemic, the 2020 General Assembly passed only a one-year budget, followed by another one-year budget in 2021. Even though some budget holes have been partially filled with federal COVID relief funds and the 2021–2022 budget was the first time since the 2006–2008 budget that there were no new spending cuts, the current budget still flat-lined funding across most areas of investment.43 As a result, underlying challenges caused by inadequate investments in schools, child welfare, services for people with disabilities and more remain unaddressed, even as new budget pressures have emerged as the state continues to grapple with COVID-19.
P-12 education
P-12 education is the largest area of General Fund investment in the state budget. While there have been important federal investments to help with needs related to COVID-19, key areas of funding, especially core per-pupil funding, for Kentucky’s public schools remains inadequate and inequitable. The state has the opportunity to begin reinvesting in kids and classrooms in the 2022–2024 budget.
Federal funds have been helping schools with COVID-related needs
As Kentucky enters the 2022 budget session, school districts have received, or will receive, a significant amount of funding through federal COVID relief funds that will be available during the upcoming biennium to help offset COVID-related expenses, begin making investments that will help improve health and safety in the school environment, and address the needs of students.
As shown in the table below, these funds are provided to districts through two primary grant programs: ESSER (Elementary and Secondary School Emergency Relief Fund) and GEER (Governor’s Emergency Education Relief). All funds must be used to prevent, prepare for and respond to the coronavirus pandemic, although the list of permissible expenses is somewhat broad.44
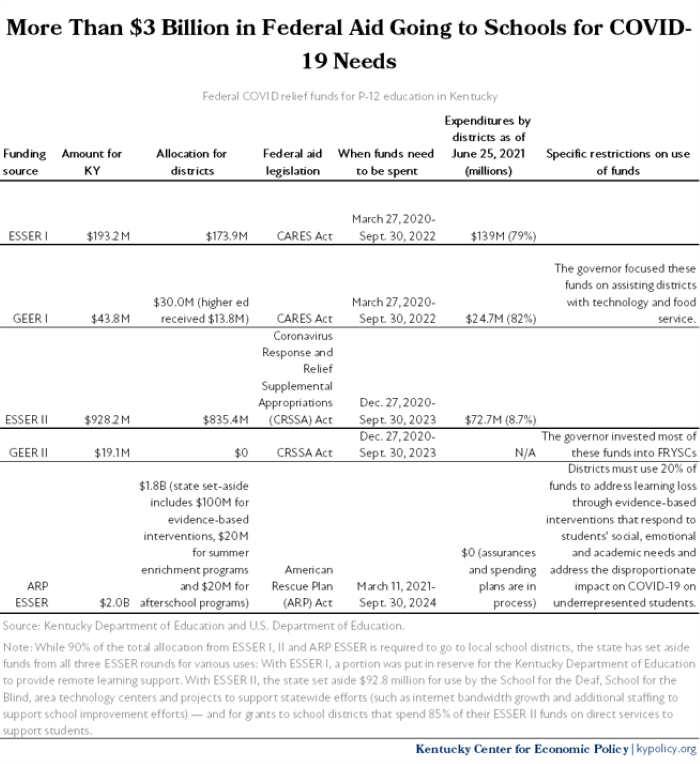 FEDERAL COVID RELIEF FUNDS FOR P-12 EDUCATION IN KENTUCKY
The state also appropriated $127 million of its ARPA funds (that were not specifically for education) to address school construction needs, which continue to grow.45 Current unmet facilities need is calculated to be over $6 billion.46 However, the state recently became aware that this use of the ARPA funds isn’t allowed under federal guidance — although there are other options being explored to fund school construction projects.47
Core P-12 public school funding has deeply eroded
Federal funds have been and will continue to be helpful to districts in addressing COVID-19 related needs. But as core state funding for Kentucky schools has continued to decline in real dollars, the state’s investments through the 2022–2024 budget are paramount. Outside of a temporary improvement in school funding with full-day Kindergarten in 2021, the 2021–2022 budget flat-lined per-pupil base funding through the Support Education Excellence in Kentucky (SEEK) funding formula at $4,000 per student, and continued to underfund school transportation.
The largest component of education funding is the SEEK formula, which provides state funding to school districts based on wealth and local effort. SEEK includes what is called a “base guarantee” of funding for every student that is established in the budget. In the current budget, the base guarantee is $4,000, where it has remained since 2019 (up from $3,822 in 2008, before education cuts that occurred with the Great Recession.48 The SEEK formula also includes additional funds (referred to as “add-ons”) for students eligible for free lunches, students with disabilities, students with “limited English proficiency,” and home and hospital services, in addition to transportation, which will be discussed in more detail later in this section.
The base guarantee is funded through a combination of state and local funds, with the state contributing more to districts that have less property wealth, and therefore less ability to raise revenues locally. The state portion declined on a per-pupil basis by $191 between 2008 and 2022, while the local portion grew by $369.49 Thus, the cost of the nominal increase in base funding is being borne primarily by local school districts. In addition, these numbers do not account for inflation. When inflation is factored in, as shown in the graph below, the per-pupil guarantee is lower in 2022 than it was in 2008 by $682 per student, a decline of 26.1%.50
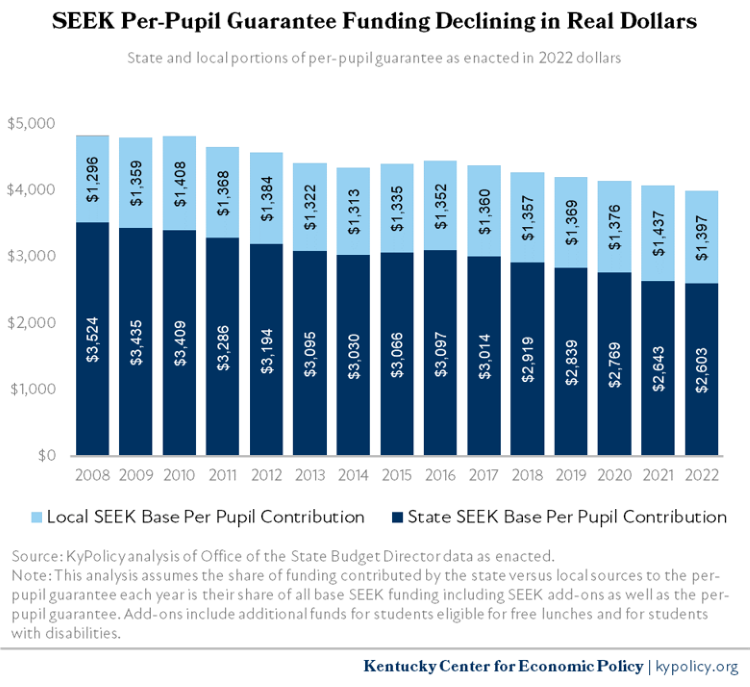 STATE AND LOCAL PORTIONS OF PER PUPIL GUARANTEE 2008-22
The shift of costs onto local school districts also occurs with school transportation funding. By statute, the state is required to cover 100% of the estimated costs of transportation (which is less than the full cost of transportation). However, as shown in the graph below, the state has not been making this contribution for a number of years, and the current budget covers just 55% of the estimated costs in 2022.
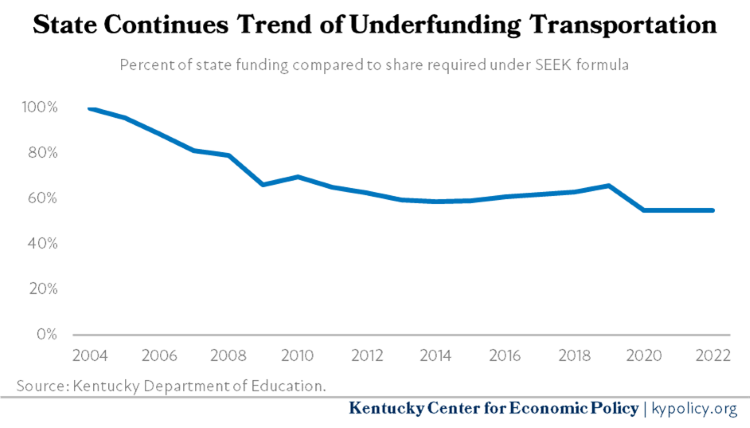 STATE TRANSPORTATION FUNDING COMPARED TO SEEK REQUIREMENTS 2004-22
Because school districts differ in their ability — based largely on local property wealth — to make up for the state shifting costs onto them, inadequate state funding also increases funding inequities between poorer and wealthier districts. Funding inequity was a primary driver behind KERA in 1990 and the creation of the SEEK formula. While equity improved after KERA, a commitment to adequate state funding has waned. That has caused the per-pupil state and local funding gap to rise, making it now close to the level it was prior to KERA.51
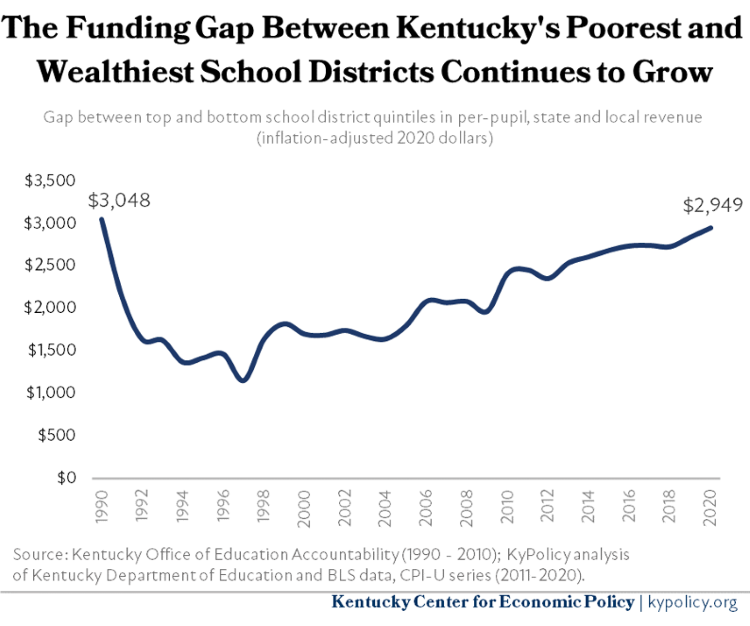 REVENUE GAP BETWEEN HIGHEST FUNDED AND LOWEST FUNDED SCHOOL DISTRICTS
While poorer districts have been disproportionately harmed by state funding cuts, all districts across the state have borne the weight of these cuts. KyPolicy’s 2018 survey of superintendents showed that, because of state budget cuts, districts had reduced course offerings, student supports and the number of staff, and were unable to provide needed raises and address often critical facility needs.52 The 2022 state budget did not address these challenges, including the need for raises for teachers (the last state-mandated teacher pay raise was a 2% raise in 2016) and other school staff.
In terms of funding for education programs outside of SEEK, in the 2021–2022 budget there were no investments in instructional materials/textbooks or professional development, and these items have not received any state funding since 2018. Extended School Services (ESS) received no increased funding for the fourth year in a row, making funding 40% lower than it was in 2008 in inflation-adjusted terms.53 Funding for Family Resource and Youth Services Centers (FRYSCs) — which provide services for families that help address non-educational barriers to learning in schools where at least 20% of students are eligible for free and reduced-price lunches — was flat-lined (at 17% below 2008 levels in inflation-adjusted terms), but then received $15 million from the Governor’s Emergency Education Relief Fund 2 (GEER II).54 The state invested $7.4 million to fund additional school-based mental health services provider positions on a reimbursement basis for 2022.55
A bright spot for education in 2021 was that, for the first time in Kentucky history, the 2021 Kentucky General Assembly provided funding for full-day Kindergarten for the 2021-22 school year through House Bill (HB) 382, a temporary $140 million investment.56 Studies have found that children who attend full-day Kindergarten learn more in reading and math than children who attend half-day programs. Prior to this year, the state provided funding for half-day Kindergarten through SEEK. Because of the clear academic advantages, almost all school districts have been offering a full-day program, causing significant budgetary strain for many districts.57
School Funding Task Force made positive recommendations, but more is needed
In 2021, the Kentucky General Assembly created a School Funding Task Force to meet in the interim, review funding for K-12 education in Kentucky and other states, and identify recommendations “to ensure the equitable and efficient funding of Kentucky’s common schools.”58 The recommendations released in November 2021 address several areas described above that need greater investment — including making full-day Kindergarten funding permanent, moving toward full school transportation funding and increasing investment in FRYSCs.59 The Task Force also recommended developing a plan to fully fund the provisions included in “the School Safety and Resiliency Act of 2019,” which currently includes both mental health staff in schools as well as School Resource Officers (SROs).
The 2022 Kentucky General Assembly should act on these recommendations, which would make modest steps forward for school funding adequacy and equity. For instance, superintendents testified to the task force that making permanent full-day funding for Kindergarten would free up local resources to support students in becoming Kindergarten-ready, make teacher salaries more adequate and competitive, enable teacher retention and address backlogged facility needs.
But without significant additional state investment in the base SEEK formula, possible because of a record budget surplus, the resource gaps between wealthy and poor districts will continue to grow, and funding will be inadequate, compromising the constitutional right of all children in Kentucky to a free, appropriate and equitable public education. While the state’s share of the base per-pupil guarantee is $2,603 in 2022, in 2008 it was $3,524 in inflation-adjusted dollars.
Opportunity to strengthen early childhood by expanding preschool
Participation in preschool is associated with improved academic outcomes for children, and the benefits can even extend to better health and economic stability later in life.60 An analysis by the University of Kentucky’s Center for Business and Economic Research found there would be a $5 benefit for every $1 the state invested to expand the state’s preschool program.61 Universal preschool can help to provide greater economic and racial equity in school by ensuring all kids, regardless of barriers their families encounter, enter Kindergarten with the skills they need to be successful.62
Eligibility for tuition-free preschool is currently restricted to 4-year-olds in families with incomes below 160% of the poverty level ($42,400 for a family of 4) and 3- and 4-year-old children with developmental delays and disabilities, regardless of income.63 In the past, the Kentucky Department of Education has advocated for the expansion of preschool eligibility without payment of tuition to 200% of the poverty level, which past estimates showed would cost $78.5 million each year.64
In addition, while full-day preschool in Kentucky has been shown to be more effective than half-day preschool in preparing children for Kindergarten, according to a 2018 report just 40% of school districts offered full-day preschool, largely because of funding challenges.65 Full-day preschool as well as full-day Kindergarten are priorities for the Kentucky Board of Education in the 2022–2024 budget.66
Half of Kentucky is a child care desert, but public investment makes a proven difference
Although funding and administration of child care assistance lies within the Cabinet for Health and Family Services and not the Department of Education, child care can be considered as a part of the continuum of education because it has such profound effects on a child’s academic career and outcomes even into adulthood. Yet half of Kentuckians live in a “child care desert” where child care is either unavailable or there are far more children than child care openings.67 This disparity is almost entirely attributable to the decrease in child care providers throughout the state, the number of which has fallen by 46.3% over the past 10 years. In 2013, a budget shortfall led the state to put a moratorium on new entrants to the state’s Child Care Assistance Program (CCAP), which provides help with child care costs for low-income families. Although this moratorium was lifted the following year, it turned what was already a difficult market for providers into an impossible situation for many to keep their doors open.68
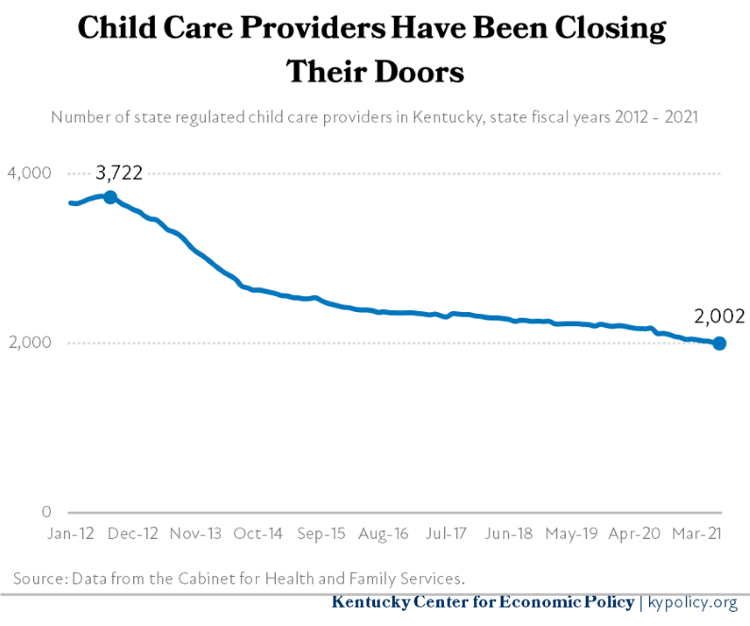 CHILD CARE PROVIDERS IN KENTUCKY 2012-21
Today, approximately 25,300 Kentucky kids benefit from CCAP.69 Beginning in the 2016–2018 budget, the General Assembly has included a $10.6 million increase in funding to raise the eligibility threshold for families from 150% of the 2011 poverty level (FPL) to 160% of the current (FPL), or $42,400 for a family of 4 in 2021, a modest but important improvement.70
Low CCAP reimbursement rates have made it difficult for child care centers to pay operational expenses while accepting children paid for by CCAP. In parts of the state where the share of state-subsidized children is high, low reimbursements have historically contributed to child care shortages. Following a 2016 increase of the reimbursement rate to providers by about $1 per child per day, the General Assembly appropriated $12 million to further increase the provider reimbursement amount in 2021 by an average of $2 per child per day.71 Now, reimbursement rates can be up to $47 per child, per day and are close to the recommended (but still inadequate) 75th percentile of market rates as laid out in the federal grant that pays for much of Kentucky’s child care assistance.72 These increases have been small steps toward fostering the availability and viability of child care centers, but are still below what is needed to provide high-quality child care, which is when the best outcomes for children are achieved.73 The average cost for child care for a toddler in Kentucky is nearly 1/3 of what it would cost to provide high-quality care according to one study.74
In addition to the needed state investments in child care, recent federal aid packages have made large investments in child care. The CARES Act sent $67.7 million to Kentucky for child care in 2020, followed by the Coronavirus Response and Relief Supplemental Appropriations Act (CRRSAA) which sent an additional $195.5 million in early 2021.75 Then in 2021, ARPA made an enormous investment of $763 million through two separate funding streams that came to the state mid-year. This combined $1 billion in federal funding propped up the child care industry through a combination of more generous subsidies to families and direct payments to state-regulated child care centers. It has also been used to offer incentive payments to employers that open new centers attached to their workplace and family care homes (regulated child care providers that operate out of a home), so as to provide more available child care spots and reduce the number of Kentucky children in a child care desert.76
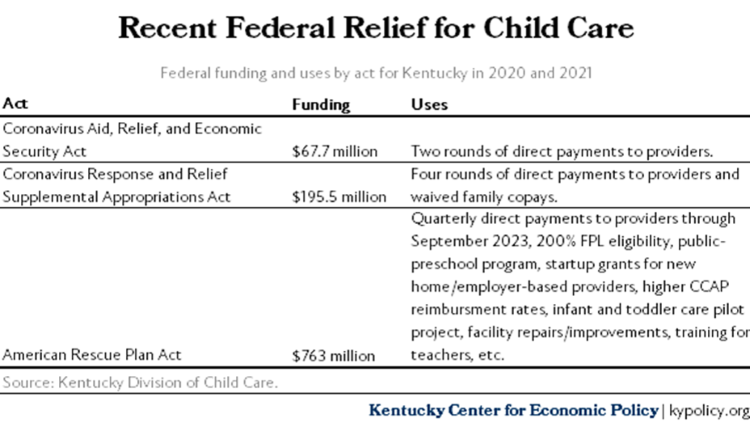 FEDERAL FUNDING AND USES BY KENTUCKY 2020 AND 2021
Yet much more sustained investment is needed to address the continuing dearth of high-quality, affordable child care in Kentucky, and the poor quality of many of the jobs it provides. These recent rounds of federal funding have shown what large federal investments can accomplish as they stopped the acceleration of center closures and began to address low pay and quality. But those funds are temporary and will run out in the coming years, and the General Assembly will need to prepare for the possibility of a permanently boosted child care program included in the Build Back Better Act if it is passed.
Postsecondary education
On the other end of the educational continuum, higher education has also experienced particularly deep state budget cuts. According to a report by the Center on Budget and Policy Priorities (CBPP), Kentucky is among the 10 states with the worst cuts to state funding for higher education since before the Great Recession.77 State funding for Kentucky’s public higher educational institutions has declined by 33.4% since 2008 once inflation is taken into account.78 This trend hinders the state’s ability to provide a high-quality and affordable public postsecondary education.
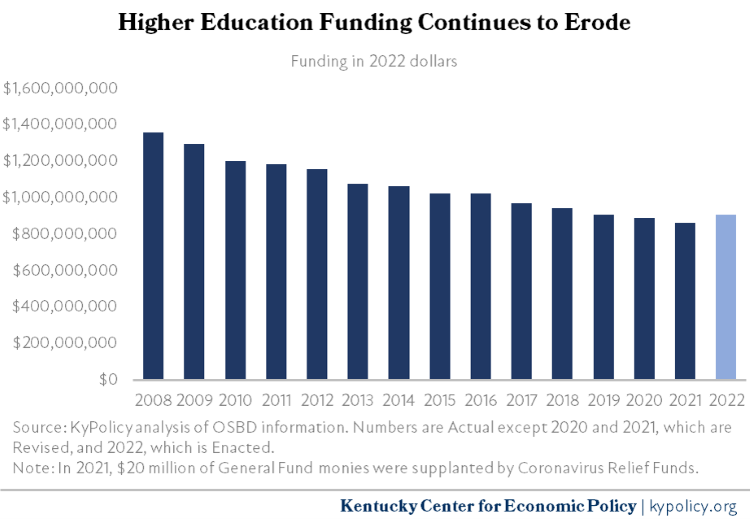 12 HIGHER EDUCATION FUNDING IN KENTUCKY 2008 22
According to the Kentucky Council on Postsecondary Education, Kentucky’s public higher education campuses have lost $178 million in state funding since fiscal year 2008, a decline greater than $500 million in inflation-adjusted terms.79 On a per-student, inflation-adjusted basis, funding is almost 40% less than in 2008.
Factored into these overall declines, the 2022 state budget included a 2% increase in funding ($17.3 million) compared to 2021 that was placed into the “Postsecondary Education Performance Fund,” to be distributed according to the performance funding model.80 As in previous years since this model has been in place, the funds for public four-year institutions primarily go to the University of Kentucky and University of Louisville, with no funding going to several smaller institutions that serve more students with low incomes and students of color (in 2022, Kentucky State University, Morehead State University and Murray State University receive zero performance funding dollars).81
For community colleges, 6 institutions located in poorer parts of the state (out of the 16 total community colleges) have received no performance funding dollars: Ashland, Big Sandy, Hazard, Henderson, Madisonville and Southeast Community and Technical Colleges.82 The 2021 General Assembly also passed Senate Bill (SB) 135, which set a floor for the level of state appropriations to higher education institutions that must be met in forthcoming years before any additional funds are distributed based on performance.83 The established floor is the actual (not inflation-adjusted) amount of funding institutions received in total (including performance funds) in fiscal year 2021. The 2021–2022 budget bill also included appropriations totaling $22.1 million to 5 comprehensive universities and KCTCS in 2022 to help with their transition to the level-dollar method for determining employer-paid pension contributions.84
College affordability is out of reach for many Kentuckians
Cumulative budget cuts have contributed significantly to tuition increases at Kentucky’s public universities and community colleges, as institutions have increased tuition and fees in order to make up for some of the revenue losses from the state at the same time fixed and other unavoidable costs have continued to increase. This shift has exacerbated the unaffordability of higher education; Kentucky ranks 6th worst among states for college affordability measured as the average net price of higher education at a public four-year institution as a share of median household income.85
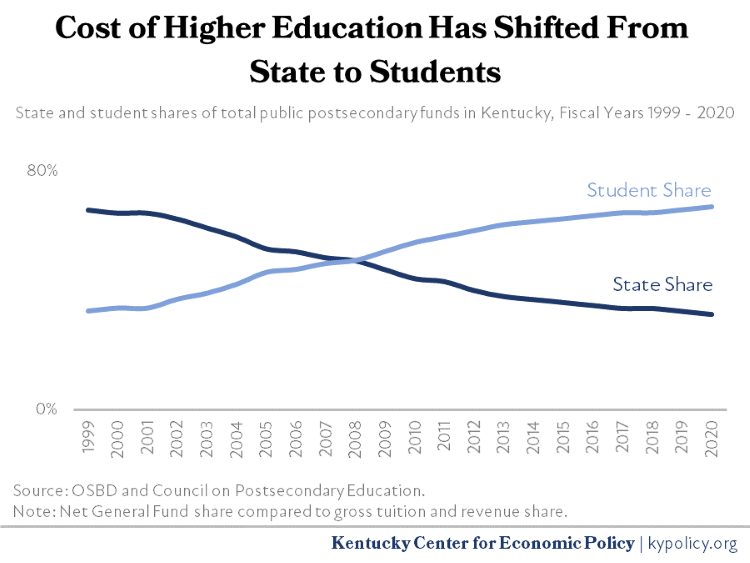 STATE AND STUDENT SHARES OF HIGHER ED FUNDING 1999-2020
Those trends result in the average net price for a public four-year school in Kentucky accounting for 30% of median household income in 2018.86 Disaggregating the data by race shows that cost is a greater barrier for Kentuckians of color. Kentucky was one of 17 states where Black households would need to spend at least 40% of their incomes to get a degree. The net price in 2018 also represented 35% of Hispanic/Latino median household incomes compared to 29% for white households.87
The 2021-22 budget included some additional state investment in need-based scholarships, with more students receiving scholarships and a small increase in the College Access Program (CAP) scholarship amount, in part due to an increase in lottery funds. However, scholarship amounts have not kept pace with the rising costs of college attendance. While the estimated cost of attending a Kentucky community college full-time for one year is $15,314, the CAP amount for a full-time student at a two-year college is $2,200 ($2,900 for a four-year institution).88 The maximum Pell amount is currently $6,495.89
Tuition and fees have gone up very little in the past two years. The tuition increases of 0.7% in 2021 and 1.1% in 2022 across the systems are the lowest tuition increases in over 20 years.90 But college affordability remains a significant challenge for many Kentuckians. A growing share of individuals and families have taken on debt as the cost of attending college has grown while wages and Pell Grant amounts have not kept pace. Currently, around 616,000 Kentucky residents have outstanding federal student loans, roughly 18% of all Kentuckians over the age of 18 (slightly higher than the national rate). The median amount owed in federal student loan debt in Kentucky is around $18,000, but more than 125,000 Kentucky residents owe more than $50,000.91
The state’s steadily rising loan default rate — which went from just under 9% in 2013 to nearly 13% at the beginning of the pandemic — indicates that borrowers are struggling to repay their loans. Looking ahead, the pause in federal student loan payments due to COVID-19 has been further extended, with payments restarting in May 2022.92 Many Kentucky students with debt do not have a degree or credential, which would improve their ability to pay down student loan debt. In a dataset of recent Kentucky students at public universities and community colleges (enrolled between 2011 and 2018) who worked in Kentucky during 2019 and 2020, about 62% have not received a degree, certificate or diploma, and 48.6% received federal loans.93
Restoration of past funding cuts should be a priority in the 2022–2024 budget
As with all institutions, the pandemic has taken a toll. Federal COVID relief funds received by Kentucky for higher education total $752.3 million with $291.4 million (39%) going to student grants and $460.9 million to support institutions.94 According to the Kentucky Council on Postsecondary Education (CPE), these funds cover only a portion of COVID-related institutional costs and foregone revenue.95
In order for funding for public higher education in Kentucky to be more adequate — to prevent harmful tuition increases from occurring, to provide more funding for institutions outside of the performance funding formula, and to enable institutions to invest more in student support services — the state needs to begin restoring past budget cuts.
CPE is requesting additional performance-based funds for public postsecondary educational institutions in the 2022–2024 budget, a total of $157.5 million over the biennium.96 Funding to maintain existing facilities is another focus of CPE’s budget request — $700 million in state funds, which would address about 10% of the total estimated need of more than $7.3 billion.97 It is also a priority to have the additional funds to ease the pension funding transition continued in the 2022–2024 budget.
Medicaid
Medicaid played a critical role during the pandemic, federal aid is helping
Medicaid is the second-largest single General Fund appropriation in the state budget, behind only P-12 education. It makes up roughly one in six General Fund dollars and one in three dollars the state spends overall (with the latter including federal dollars that flow through the state budget).98 Investments in health create long-term dividends in the economy and well-being of the state. One of the starkest examples of this is the huge decline in uninsured Kentuckians, with the rate of uninsured falling from 14.3% in 2013 (the year before Medicaid expansion) to 6.4% in 2019 (the most recent year for which data is available), a 55% decline overall. Medicaid’s ability to cover groups that have had historical and structural barriers to coverage was profound, reducing the uninsured rate among Black Kentuckians by 61% and Kentuckians of two or more races by 73%.99
Kentucky’s Medicaid costs are almost entirely driven by three factors:
- The federal share of overall Medicaid expenditures known as the Federal Medical Assistance Percentage (FMAP),
- The number of people who are covered, and
- The cost of providing medical care.
Medicaid is a great deal for the commonwealth because it is largely paid for by the federal government. Accounting for state and federal dollars, in 2021, Kentucky spent $9.7 billion on traditional Medicaid benefits and $4.4 billion on expanded Medicaid benefits for a total of $14.1 billion. Of that, the state was responsible for $2.6 billion in combined General Fund and restricted agency funds and the federal government paid in $11.5 billion. This means that for every state dollar invested in Medicaid in 2021, the federal government invested $4.33.100
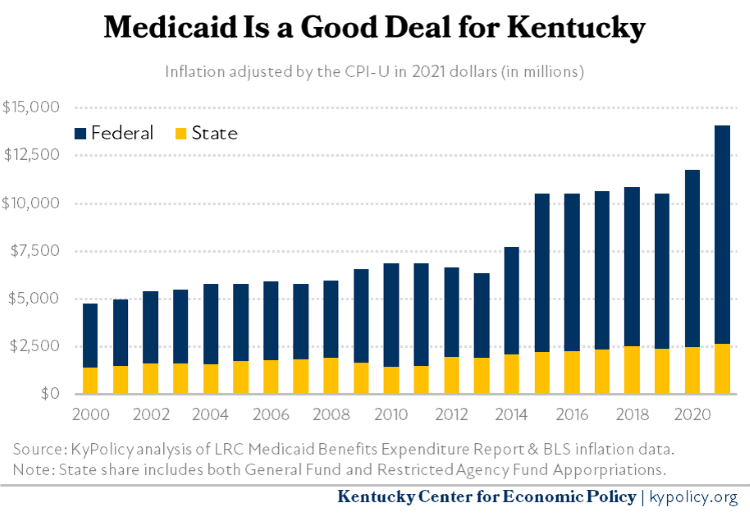 FEDERAL AND STATE MEDICAID FUNDING IN KY 2000-2021
In 2021, state and federal spending on Medicaid increased 21.5%, or by $2.5 billion year-over-year. The Department for Medicaid Services attributes this increase to a rise in enrollment (51.5% of the increase), the implementation of the Hospital Reimbursement Improvement Plan from HB 183 (26.3% of the increase), an increase in direct payments to university hospitals (12.8% of the increase) and a decrease in the state’s drug rebate program.101 This large increase in spending was almost entirely borne by an increase in provider contributions through restricted agency funds (which hospitals benefitted from through greater federal reimbursements), and a massive, temporary influx of federal Medicaid spending. General Fund spending on Medicaid rose only 1.8% between 2020 and 2021.
The federal share of Kentucky’s costs has increased dramatically
There are two FMAPs for Kentucky — one for traditional Medicaid (the eligibility criteria that includes pregnant women, children, people with various disabilities and the elderly, all of whom were eligible prior to the Affordable Care Act) and a more generous FMAP for expanded Medicaid (the eligibility category established by the Affordable Care Act that includes all adults who earn below 138% FPL). Kentucky had been increasing its FMAP for expanded Medicaid costs since 2017, but paid its highest state share in the last biennium of 10%. Kentucky will continue paying 10% of expanded Medicaid costs indefinitely, making only the cost of care and the number of enrollees ongoing variables in paying for that part of Medicaid.
For traditional Medicaid, the federal share of costs depends on the economic well-being of each state, and ranges from around 50% to just under 75%. Kentucky’s traditional Medicaid FMAP increased from 71.8% in federal fiscal year (FFY) 2020 to 72.1% in FFY 2021, which, though seemingly small, reduced what Kentucky paid by millions of dollars.102 For Federal Fiscal Year (or FFY which runs from October to September) 2022, it will further increase to 72.8%.103 On top of Kentucky’s normal traditional Medicaid FMAP is an additional 6.2 percentage point increase to assist with the added cost to states of the COVID-19 pandemic on both enrollment and medical care — leading to an FMAP of 78.3% and 79.0% in FFY 2021 and 2022 respectively. Applied to Medicaid spending in State Fiscal Year (FY) 2021, that is $601.3 million.104 Including the months since the end of SFY 2021, state savings have likely exceeded $1 billion, and Kentucky will continue to save significant amounts of General Fund monies until it expires. Under current law, that will occur at the end of the calendar quarter in which the federal emergency declaration related to COVID-19 expires; if the Build Back Better Act passes, it will begin phasing out in April 2022.105
Kentucky’s blended FMAP (expansion and traditional Medicaid) was approximately 81.3%, with Kentucky’s General Fund and restricted agency funds paying the remaining 18.7% — the lowest in at least the past 21 years. This is largely thanks to the fact that Kentucky is now receiving a consistent 90% expansion FMAP (it had been rising each year to reach 90% until last fiscal year) and the 6.2 percentage point increase for traditional Medicaid.
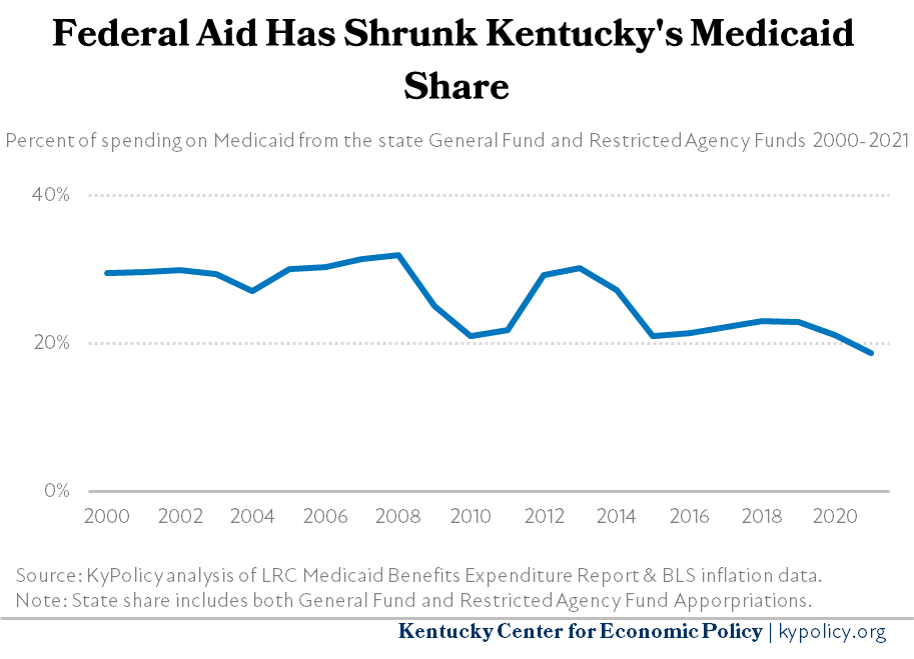 KENTUCKY GENERAL FUND SPENDING ON MEDICAID 2000-2021
Medicaid enrollment ballooned during the worst of the downturn, but has begun to subside
When the pandemic-triggered economic downturn led to tens of thousands of Kentuckians losing health coverage, the Kentucky Department of Medicaid asked the federal government for permission to provide a form of temporary coverage known as presumptive eligibility (PE). This program was wildly successful in accomplishing that goal, covering nearly 350,000 people between March 2020 and July 2021 for 6 months at a time. In July 2021, PE Medicaid enrollment fell from 128,102 to 9,548 as all those who enrolled in January used up their 6 months of eligibility at the end of June. This dramatic decrease amounted to a 6.0% decrease in overall Medicaid enrollment.106
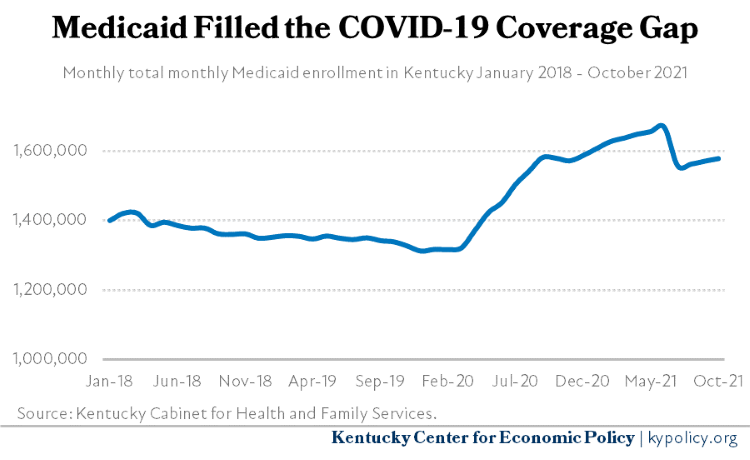 MONTHLY TOTAL MEDICAID ENROLLMENT JAN 2018 TO OCT 2021
The cost of providing care has risen, but has not greatly affected General Fund monies
The 2021 General Assembly passed an increase in the Hospital Rate Improvement Program (HRIP) through HB 183, which directs Medicaid to pay hospitals the average commercial rate for inpatient care and charge those hospitals an assessment required to meet the state match. This transaction occurs through restricted agency and federal funds, rather than General Funds, and is estimated to pay hospitals approximately $1 billion per year above what they receive through their normal Medicaid reimbursement.107
The other indicator for how the cost of care drives overall Medicaid spending is the per-member, per-month average cost, which increased 2.3% between 2020 and 2021. Traditional Medicaid costs grew 5.9% year over year, rising from an inflation-adjusted $845 to $895. Meanwhile, the cost of covering each Medicaid member under the expansion actually fell 2.8%, from $601 to $584. Again, given the increase of the traditional Medicaid FMAP of 6.2%, the increased cost of care was partially absorbed by the swell of federal funding.108
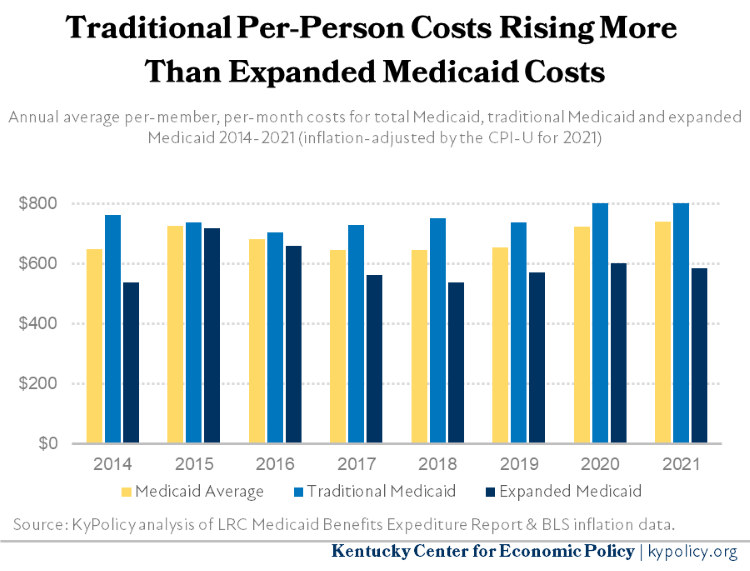 COSTS PER PERSON AND PER TYPES OF MEDICAID 2014-2021
In terms of budgetary needs in the 2022–2024 Budget of the Commonwealth, state lawmakers will likely need to prepare for the Build Back Better Act phase out of the enhanced 6.2 percentage point FMAP which will occur in the first year of the next biennial budget, phasing down to 3 percentage points in April to 1.5 percentage points in July and phasing out entirely in October.109 This will lead to a significant increase in the state’s contribution for traditional Medicaid costs. That increase will be partially offset by a decline in enrollment as a required maintenance of effort tied to the increased FMAP has kept the state from disenrolling people who are no longer eligible (except when the enrollee has moved out of state, passed away or asked to be removed from Medicaid). Barring another economic downturn (when, historically, Medicaid enrollment grows the most), enrollment growth itself will likely not be a major driver of cost during the next biennial budget.
Improvements needed for programs that provide Kentuckians with care at home and in their community
Traditional Medicaid pays for in-home care for individuals with significant health care needs, such as intellectual or developmental disabilities and brain injuries, through 1915c waivers, sometimes called Home and Community Based Service (HCBS) waivers. These programs are vital to supporting Kentuckians with disabilities so they can stay in the community rather than in nursing homes or state-run institutions, which are more expensive and less desirable for many people. As of June 2021, 33,412 Kentuckians used these services.110
One major issue for these programs is that waiting lists have grown and the previous two budgets did not add additional slots so that people could move off the waiting list and begin receiving waiver services. This growth was driven entirely by increases in Kentuckians seeking services through the Michelle P (community and home-based care for Kentuckians with intellectual or developmental disabilities) and Supports for Community Living (SCL) programs. Not everyone on a waiting list is actually eligible for a slot, so the number of people who could actually receive services through these programs is likely smaller. But in total, a lack of sufficient state funding has led to 10,327 people waiting for the state to tell them if they can receive these services. Michelle P and SCL services are costly, at $32,488 and $77,429 per person per year respectively, so reducing or eliminating the waiting list would be expensive. But it is badly needed.111
Four of the six programs have no waiting list:
- Acquired Brain Injury – Acute,
- Acquired Brain Injury – Long Term,
- Home and Community Based (community and home-based care for older Kentuckians, children and adults with disabilities), and
- Model II (community and home-based care for Kentuckians who are ventilator dependent).112
Another major issue facing the 1915c waivers is the low reimbursement rates for these services, which is leading to a wage crisis for the direct care workers in that industry. These low wages for positions that are extremely demanding and require training are leading to high turnover rates and little interest from prospective employees. Industry associations have requested a 25% across-the-board increase for all 1915c waivers and a 50% increase for SCL and ABI residential services in order to deal with the staffing difficulties that long preceded the pandemic and subsequent downturn. Additionally, they recommend annual cost of living adjustments moving forward so that this issue is not a perennial one.113
A final 1915c issue that the General Assembly will need to consider is the creation of a seventh waiver program for Kentuckians with severe mental illness (SMI). Currently, there are no comprehensive services provided through Medicaid for Kentuckians with an SMI, especially one that helps them remain in the community with support. Experts believe Kentucky would need to pay $1.3 million to provide a sufficient number of slots for these services, drawing down a further $3.1 million in federal funds.114
ARPA provided a one-year increase of 10 percentage points to the state’s FMAP for home and community based services. The state decided to use a substantial amount for retention and sign-on bonuses for direct care workers, in an attempt to fill positions vacated due to low wages and high turnover. They additionally chose to use a smaller portion for one-time purchases for home modifications for waiver participants, direct care worker training, a number of studies on rates and services, and digital infrastructure improvements. In all, the state anticipates receiving an extra $104 million through ARPA for this purpose.115
Human Services
Social worker turnover is harming Kentucky’s child welfare system
Kentucky has the highest rate of abused and neglected children in the nation — at 20.1 per 1,000 children.116 Across the commonwealth, 9,122 children live in out-of-home care.117 This problem creates an immense need for state services for children and families across the commonwealth, has overwhelmed Kentucky’s child welfare system and led to large amounts of staff burnout, turnover and an inexperienced workforce within the Department of Community Based Services (DCBS).
Social workers in DCBS serve on the frontline of the state’s child protection program. The best-practice caseload for child welfare workers is 15-18 cases, but in Kentucky the average was 26 cases per worker in September 2021.118 In addition to high caseloads, social workers often suffer from secondary post-traumatic stress, are exposed to high risk scenarios, and receive low pay.119 The pay for a Social Service Worker I, social workers with less than a year of experience, is approximately $33,650 per year, or around $16 per hour.120
This combination of a stressful work environment, low pay and high caseloads has led to significant rates of turnover. In 2021 alone, around 650 caseworkers have left, and as of June 2021, 44% of the social workers at DCBS had less than one year of experience.121 Throughout 2020, DCBS asked outgoing social workers why they chose to quit their jobs and the top responses they gave included:
- Better job opportunities elsewhere,
- poor pay,
- high caseloads, and
- career change.122
Hiring more social workers to reduce caseloads and paying all social workers more would be the answer to this workforce issue, both of which have been proposed in past budgets, but have been rarely and incompletely acted upon. This year again, DCBS is requesting $7 million more for 76 additional social workers and increased professional development and training opportunities.123
Removing children from their parents is a last-resort step aimed at reducing harm, but is itself a traumatic experience that is far worse than finding ways to keep families together safely. To address this, Congress passed the Family First Prevention Services Act which pays for half of the cost of state-run, evidence-based services aimed at intervening prior to the need for child separation.124 In 2021, Kentucky spent $24.9 million on prevention services, which are designed to intervene before maltreatment occurs among those with one or more risk factors and among families where maltreatment has occurred but removal may not yet be deemed necessary. In 2020, when the state spent $21.8 million on prevention services, DCBS was able to directly serve 3,367 families including 6,132 children, 93% of whom were able to remain with their parents.125
DCBS is the largest agency in state government providing social services that range far beyond the child welfare system. It plays a critical role in supporting low-income Kentuckians, and evidence suggests it plays a role in helping Kentuckians get and stay healthy. Researchers have found that higher ratio of spending on social services to public health services actually yields better health outcomes, particularly for conditions such as asthma, adult obesity, poor mental health, lung cancer, heart attacks, Type 2 diabetes and even mortality. While the study didn’t suggest an ideal ratio, it did suggest that policymakers need to think of social service spending as a form of public health intervention.126
Other human services needs going unmet
Kentucky’s Department for Behavioral Health, Intellectual and Developmental Disabilities (BHIDD) provides a wide range of services for addiction treatment, community living for dependent adults, long-term institutional care for those with severe needs and outpatient mental health services. This division has not received a meaningful state funding increase since the 1990s and was cut by 4.3% in the 2018–2020 budget (though the cuts to programs within the department were likely deeper as additional funds for higher pension costs were included in the budget).127 Funding has therefore failed to keep up with inflation and the growth in demand for services.
The state’s Community Mental Health Centers (CMHCs) are connected to the BHIDD. Among many other functions, these centers act as a drug treatment safety net, a critical service as Kentucky has the nation’s 8th-highest drug overdose death rate at 32.5 out of 100,000 as of 2019.128 This health crisis strains not just Kentucky’s CMHCs, but the state’s justice, child welfare and public health systems as well, meaning additional investments in CMHCs will help address corresponding challenges in these other systems.
In addition to 1915c services provided by Medicaid, Kentucky also cares for the aged and disabled through the Department for Aging and Independent Living (DAIL). DAIL administers both federally and state-funded programs that help keep dependent adults out of institutionalized care. An example is State Guardianship, which helps care for 4,481 disabled adults in the community. Caseloads for this program should be at a standard of 20 per state worker, but range from 34 to 45 depending on the region.
In 2021, DAIL and the federal government made an agreement wherein Medicaid can cover 50% of the administrative costs of the Guardianship program, providing an additional $5.7 million and allowing DAIL to hire an additional 64 caseworkers. This leaves a gap of 45 case workers needed in order to achieve the recommended caseload of 20.129 Other programs administered by DAIL include Meals on Wheels, Hart-Supported Living, the Traumatic Brain Injury Behavioral Program and certification authority for assisted living and adult day care settings. The share of Kentuckians age 65 and older is projected to rise from 16.8% in 2015 to 21.6% in 2040, meaning more Kentuckians will require the services provided by DAIL. However, the department has seen no meaningful increase in funding for years.130
Public health workforce was hampered going into pandemic
The Department for Public Health oversees a broad swath of over 150 programs and services that range from facility inspections, newborn screenings, immunizations and disease outbreak prevention. Many of these services are performed through partnerships with local health departments. Yet increased pension contribution requirements, repeated rounds of budget cuts and a stagnation in public sector pay has led to a 37.4% decline in the public health workforce, with 1,493 fewer workers in 2020 than in 2012.131
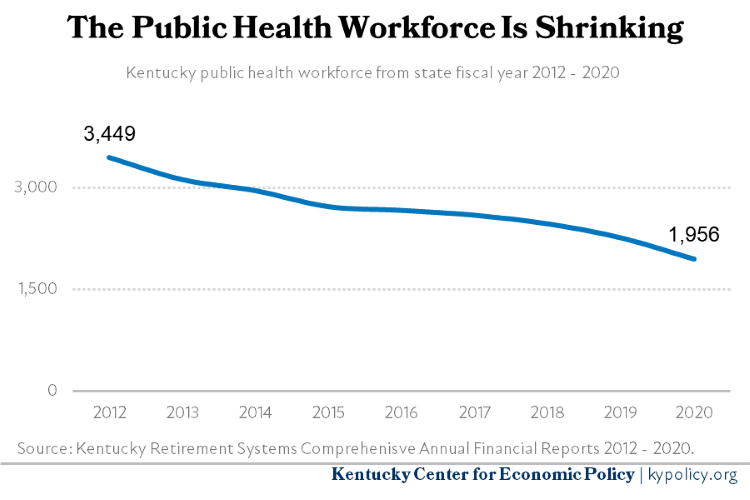 KY PUBLIC HEALTH WORKFORCE 2012-2020
This reduction in the workforce weakened Kentucky’s preparedness for the COVID-19 pandemic. In an attempt to stabilize the loss of workforce, the General Assembly passed HB 129 in 2020, which provides a General Fund appropriation to local public health departments on a service area population-basis to support core public health needs.132 While this funding is aimed at keeping the remaining public health workforce in place, it does not address the prior reduction. Some funding from ARPA was specifically appropriated for that purpose, but those funds are temporary. For 2022, local public health departments are requesting an additional $8.9 million for their core public health services and to help cover the increase in pension costs.133 According to the Kentucky Health Departments Association, these funds cover only the minimum staffing needed to provide the core and statutorily required services.
Criminal legal system
Unlike critical investments in other areas of the budget such as education and health care, investments in incarceration actually lead to individual, family and community harms. And, unlike other areas of the budget, the state has increased funding for incarceration over the years. Enacted spending on corrections is $626 million in 2022, 72% higher in nominal terms than was appropriated in 2010 (prior to the last significant broad-based reform to Kentucky’s criminal statutes, 2011’s HB 463), while in comparison over the same period of time, total General Fund expenditures have grown 45%.134 High and rising incarceration in Kentucky is not inevitable, but is in part the result of the legislature’s passage of laws that enhance penalties for existing crimes or that create new crimes. Given this context, the state has an opportunity and a need in the 2022 General Assembly to create savings by enacting laws that reduce incarceration.
There are long- and short-term harms from mass incarceration on the health and well-being of our communities. As a result of being currently or previously incarcerated, Kentuckians and their families experience many of the factors that research shows lead to poor health outcomes, including income instability, limited access to health care and barriers to quality housing.135 Imprisonment is associated with a shorter life expectancy, higher rate of infant mortality, and numerous other negative impacts on the health of families and communities.136 Because people of color are unjustly overrepresented in our system, they are disproportionately affected by the negative health outcomes associated with incarceration.137 While Black Kentuckians make up 8% of the state’s population, they are 21% of Kentucky’s prison population.138
The future of Kentucky children is also affected. Children with incarcerated parents struggle more in school, have poorer health outcomes and fewer economic opportunities.139 Given Kentucky has one of the highest rates of parental incarceration in the nation, the stakes for children and families are large.140
Corrections budget continues to grow despite some short-term reductions in incarceration
For the first time in many years, the average number of people serving felony sentences in Kentucky prisons and jails in Department of Corrections (DOC) custody declined in fiscal year 2021; however, this anomaly was due to COVID-19 and is not expected to be sustained. There were 1,881 felony sentence commutations by the governor in 2020 in response to the COVID-19 pandemic, as well as court closures that have resulted in backups in the justice system.141 At the same time the graph below shows there has been a big drop in the number of people serving time for felony convictions in Kentucky, the state’s jail population and particularly those in county custody — which includes people being held pretrial (primarily due to being unable to afford money bail) — has been rising steadily.142 Since the courts have reopened and cases are once again being processed, the reduction in those serving sentences for the DOC is expected to reverse, absent significant changes in Kentucky’s criminal laws.
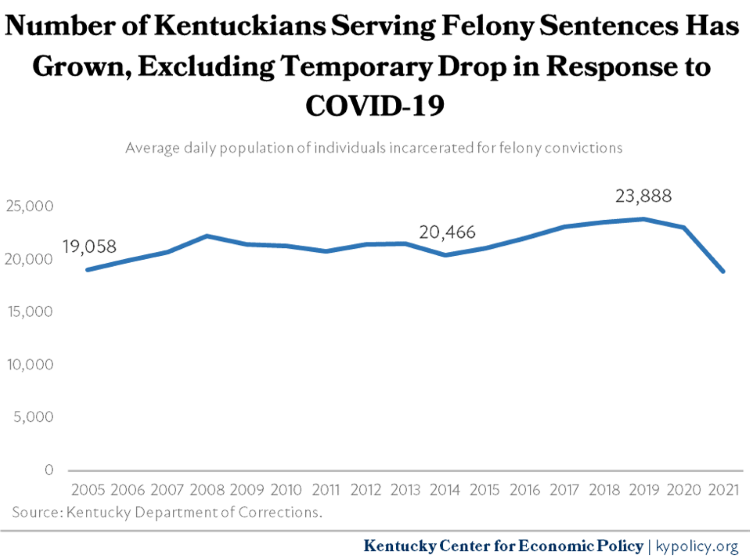 NUMBER OF KENTUCKIANS SERVING FELONY SENTENCES 2005-2021
In FY 2021, as a result of the sentence commutations, the state budget appropriation for corrections spending was $42 million less than it would otherwise have been.143 Overall, the General Fund appropriation to corrections was reduced from $633.7 million to $531.9 million, due to a combination of the population reductions and substitution of General Funds with CARES Act relief funds. However, state spending on corrections is expected to increase to $626 million in FY 2022, despite a forecasted drop in the number of people incarcerated, due in part to increased costs to try to keep staff and incarcerated people safe during the pandemic.
There have been some concerns among legislators, and in the media, about the rearrest of individuals released due to COVID public health concerns. The rates of rearrest (or “recidivism”) among those individuals are not in fact higher than for individuals typically released from jail and prison in Kentucky, however. The state’s consistently high rates of recidivism are certainly concerning (41% of individuals who leave incarceration end up reincarcerated within 2 years), and policies to improve reentry are greatly needed.144 One positive step to more successful reentry was 2021’s HB 497, which, among other things, finally does away with the state’s partial ban from receiving food assistance (Supplemental Nutrition Assistance Program or SNAP benefits) or cash assistance (Temporary Assistance for Needy Families or TANF) for people who have previously been convicted of a drug-related felony.145
Small steps forward with sentencing changes, but much more is needed to have a significant impact
The 2021 Kentucky General Assembly passed two bills that are expected to have a positive impact on the state corrections budget by decreasing incarceration. HB 126 increased the amount at which theft becomes a felony from $500 to $1,000, making it more in line with other states; according to the bill’s corrections impact statement the impact will be “significant.”146 HB 402 increased the amount in past-due child support payments (“flagrant nonsupport”) that constitutes a felony from $1,000 to $2,500, an important change, particularly given the fact that incarceration and a felony conviction make it more difficult for someone to make these payments. The corrections impact of HB 402 is considered to be minimal.147
Sentencing policy that would further reduce incarceration and enable the state to invest savings in communities include making some felony charges misdemeanors such as drug possession and possession of a forged instrument.148 Kentucky should also eliminate, or at least severely limit, its “Persistent Felony Offender” (PFO) law, which is among the broadest and most severe mandatory minimum laws in the country.149
At the same time the state needs incarceration-reducing policies, policymakers should avoid making the problem worse by continuing to create new crimes and enhance criminal penalties. In addition to increasing incarceration, these policies do not make our communities safer, and in many ways do more harm. Over the past decade, the Kentucky General Assembly has passed just 10 bills that reduce incarceration, while passing 59 that increase it.150
Legislature should remove incentives for counties to incarcerate people in DOC custody
A significant barrier to state law changes that would reduce incarceration at the state and local level and result in corrections savings is the existence of perverse state and local financial incentives for counties to incarcerate people on behalf of the DOC. Among states, Kentucky has the second-highest share of individuals in state custody incarcerated in local jails — close to half of individuals convicted of felonies and in the custody of the DOC serve their time in jails. Only Louisiana has a higher share, and no other states come anywhere close.151 By state law, starting in 1992, those serving Class D felony sentences must stay in a county jail; those with some types of Class C felonies can also be housed in county jails, as well as any person sentenced and awaiting a prison bed.152 This arrangement, in the context of state policies and practices that are driving high rates of incarceration, has resulted in severe overcrowding of local jails.
It is financially beneficial to the state for individuals convicted of felonies to be held in county jails because it costs much more to incarcerate someone in a state prison. The average cost paid to county jails per person is $35.43 per day (the per diem from the state is $31.34 but there are other costs, for example medical, for which county jails get reimbursed). That is far less than the cost to incarcerate someone in a state facility, which in 2021 ranged from $83.85 at the Bell County Forestry Camp, to $237.79 at Southeast State Correctional Complex, with an average cost across all state facilities of $97.60.153
Even though this practice compounds overcrowding in local jails, counties seek out the revenues associated with housing state prisoners to offset the costs for which they are legally responsible. Counties must maintain their jails and pay costs including medical expenses associated with incarcerating individuals awaiting trial and serving sentences for misdemeanor convictions.154 The state’s relatively low rates of pretrial release without financial conditions (“money bail”) — which are especially low in certain counties — result in many people who are arrested being held in jail while awaiting trial because they cannot afford bail; in addition to the significant costs to individuals and families, the costs of pretrial incarceration are considerable for counties.155 To offset costs, counties hold more individuals who are in state custody for whom they are paid. However, since the payments from the state for these individuals are less than the actual cost of incarcerating them, some local jails make ends meet by holding more people in the same amount of space, creating overcrowding.
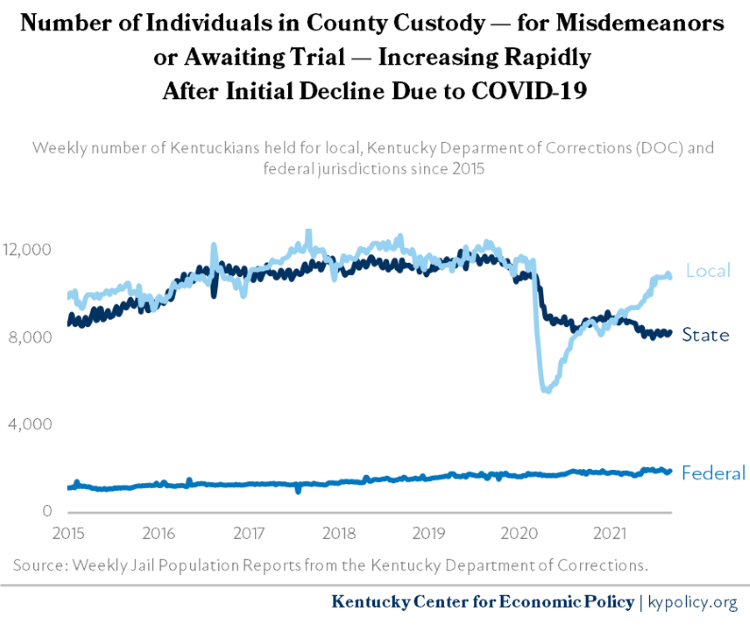 NUMBER OF INDIVIDUALS IN COUNTY CUSTODY IN KENTUCKY 2015-2021
In addition to the local jail expansion that has happened across the state (most recently in Laurel and Knox counties) and severe overcrowding in local jails, this complicated fiscal situation has also resulted in opposition from jailers and others in county government to needed justice reforms.156 Along with sentencing policy changes to reduce incarceration, in order to permanently reduce our state’s high rates of incarceration, counties must stop expanding their jails. The legislature should develop a comprehensive plan to phase out the use of local jails completely for people in state custody over a set number of years, in partnership with local governments and the DOC, in a manner that helps to identify and address local fiscal issues and concerns through the transition period. This transition must also include significant changes to the state’s pretrial system that would result in fewer people incarcerated while awaiting trial (and reduced county costs).157 The resulting reduced incarceration could free up some local funds that would be better spent on community-based substance use disorder treatment and other supportive services for people in the community.
In an attempt to address county jails’ fiscal needs and provide services for people serving a state sentence in a county jail, the 2021 General Assembly passed HB 556, which appropriated $30 million in General Fund resources for FY 2022 to provide additional payments to local jails providing these services. The payments range from $300 to $1,000, and are awarded when an individual serving a state sentence leaves incarceration having completed a DOC-approved program or programs resulting in a sentencing credit.158 The appropriation also provides funding for an increased per diem for jails of $2 or $10 per day, for each person enrolled in a program while in the facility with the amount dependent on the program.159
While the opportunity to participate in a program may have some benefit to people who are incarcerated, the state’s focus should be on reducing incarceration — and providing needed services and supports in communities — rather than expanding programs in jails. Counties are already incentivized to expand jails in order to receive funds for housing individuals in state custody. These additional state dollars for programming could further incentivize jail expansion, and the expansion of jails has been shown to contribute to increased incarceration.160
Significant underfunding of public defenders, among other areas, creates staffing issues
At the same time the General Assembly needs to make much-needed policy changes to reduce incarceration and its human and fiscal costs, greater investment is needed in the Department of Public Advocacy (DPA) to provide a high-quality public defense to Kentuckians in the criminal legal system who cannot afford a private attorney. Public defense is constitutionally required in Kentucky, but inadequate funding is hindering the state’s ability to provide people in the court system with this service. According to interim testimony from the state’s Public Advocate, low staff salaries at DPA — even compared to attorney positions in other state agencies — have led to high turnover.161 In July 2021, DPA lost 21 employees including 13 staff attorneys and 4 supervisors, a loss of 4% of statewide staff in a single month. In locations like Maysville and Stanton, that means a caseload increase for remaining DPAs of up to 33%.
In addition to high caseloads, the Public Advocate detailed other consequences of inadequate funding for DPA:
- An unreliable and delayed court system due to the frequent reassignment of cases and cases being handled by less experienced, unprepared attorneys,
- Waste of state resources due to constant recruiting and training, and
- The growing possibility that the system will cease to function due to a complete lack of public defenders in some areas, not enough leaders to take responsibilities for cases, and too few qualified public defenders for capital and complex cases.
In the 2021–2022 budget, funding was provided for modest salary increases in a few areas within the Justice Cabinet. For instance, the Kentucky State Police (KSP) received $5.1 million in additional funding to provide salary increases for state troopers in accordance with their statutory salary schedule.162 However, DPA did not receive salary increases. According to the Public Advocate, it would cost an additional $5.6 million a year for needed raises.163
Low salaries also contribute to turnover for workers in correctional facilities, which can lead to poor and even dangerous conditions for both workers and incarcerated people.164 And even after an additional $3.6 million was provided in the 2021–2022 budget for a 15% salary increase and to transition from a 37.5 to 40-hour work week for people working at the State Police Laboratory, KSP lab workers are still the lowest paid in the nation according to testimony by the KSP before an interim committee.165
Public-sector jobs
When it comes to the imperative to invest, a consistent theme across budget areas is poor, eroded job quality for public-sector workers. From early childhood and home-based care providers to public defenders and teachers, a crisis in job quality is leading to high rates of turnover, unexperienced staff and staff shortages, limiting the state’s ability to provide public services.
According to the Personnel Cabinet, there were 33,201 combined executive, judicial and legislative branch state employees in FY 2020 with an average salary of $45,116 — below what is needed for a modest but secure livelihood for many families in Kentucky (a basic family budget is $68,238 for a family of 4 in Franklin County, for example).166 This $45,116 average represents an inflation-adjusted decline of 1% since 2010.167 During that same timeframe, the average annual salary for private-sector employees rose an inflation-adjusted 12%.168 As a result, the average state employee earned 89% of what the average private-sector employee earned in 2020, or $5,833 less. This lower salary exists despite the fact that state employees are far more likely to have higher levels of education than employees in the private sector.169 A 2012 KyPolicy report found that on an apples-to-apples basis, Kentucky public-sector workers made 12.8% less in total compensation than comparable workers in the private sector—before the further widening that occurred over last decade.170
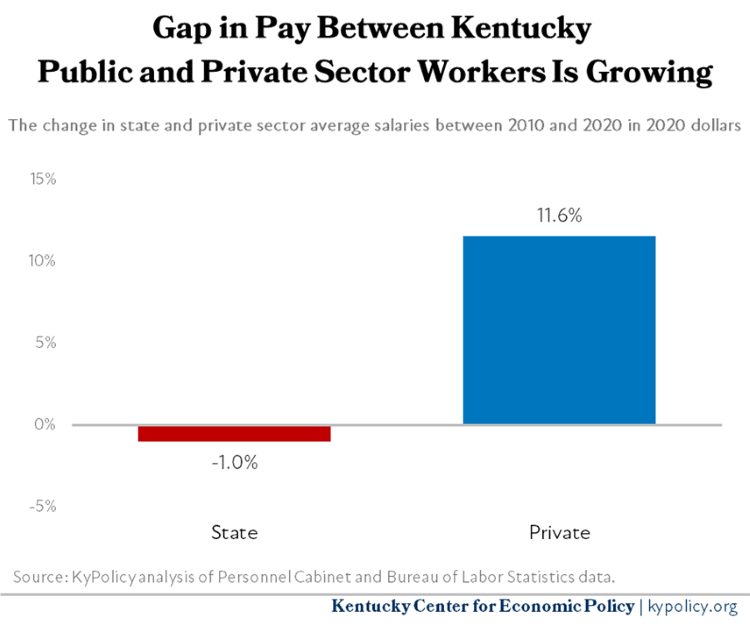 CHANGES IN STATE AND PRIVATE SECTOR AVERAGE SALARIES BETWEEN 2010 AND 2020
In the context of the economic recovery from COVID, one big consequence of this poor job quality is that while all other industries have rehired some or all of the net workforce lost in April 2020 due to the economic fallout of the pandemic, state government has shed an additional 4.7% of its workforce as of September 2021.171
Because the General Assembly has allowed state compensation to atrophy over the past decade, even modest across-the-board raises to keep up with wage increases in the private sector would be expensive. For example, a 10% across-the-board raise would cost $273 million including added pension and payroll tax expenses.172 Though there have been recent one-off bonuses through federal funds within certain executive branch departments to increase retention and attract new public employees, there has not been even a 1% across-the-board salary adjustment for state workers since 2015. The last 5% increase occurred in 2001.173 State workers have not seen any across-the-board pay increase in 9 of the past 11 years.
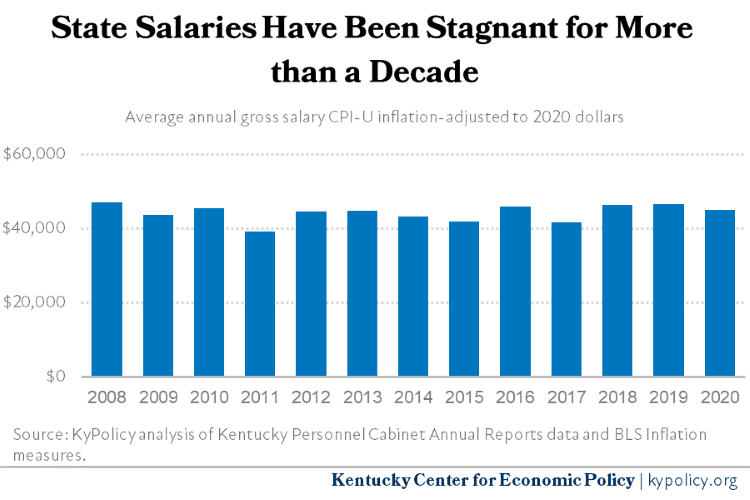 AVERAGE ANNUAL STATE SALARIES 2008-2020
In addition to inadequate salaries, the shift away from defined benefit pensions in 2013 is causing retention problems across state government.174 Starting in 2014, new employees were put into hybrid cash balance plans that have elements of both defined benefit and defined contribution or 401k-style plans. As of 2021, 12,389 of the 33,518 active employees in the Kentucky Employees Retirement System (KERS) are in the cash balance plan.175 The plans guarantee only a 4% rate of return on investments for non-hazardous employees. Unlike pension plans, the portability of cash balance plans provides less of an incentive for employees to stay in public service, and the risk of a lower ultimate retirement benefit compared to a pension makes public service less attractive.
Pension funding on stable, positive trajectory
Some have floated the idea of using a large portion of one-time state surplus dollars for an extra contribution to the Kentucky’s pension funds. But there are several reasons additional contributions should not be a top priority. Ever since the state resumed making full actuarially determined contributions to the systems — beginning in 2014 for the Kentucky Employees Retirement System and 2017 for the Teachers’ Retirement System — the plans have been on the path to better health. The existing liabilities will be paid only through compounding interest resulting from steady contributions over very long periods of time, and not in the short term. Pension plans do not have to be 100% pre-funded on an actuarial basis to be healthy, and in fact Kentucky and other states’ plans have not been 100% funded for almost all of their long history even while they have reliably paid all benefits owed.176
Kentucky’s pension plans had a strong year, with investment returns of approximately 25% for the Kentucky Public Pension Authority plans and 30% for the Teachers’ Retirement System. Total assets across pension plans rose from $42 billion in 2020 to $52 billion in 2021.177 Putting an extra $1 billion into the plans using a large portion of the state’s revenue surplus, as has been suggested, would simply raise those assets to $53 billion (a modest 2% increase) while making those dollars unavailable for the immediate needs of reinvesting in core public services and providing relief to those still hurting in the pandemic.
Instead, the state should continue to make the full actuarially required contribution to all state plans. In the new two-year budget, the contribution on behalf of the Teachers’ Retirement System will increase by approximately $90 million a year above 2021 levels due to the adoption of more conservative actuarial assumptions (number takes into account the end of past bond payments). The General Assembly should also use surplus monies to continue providing funding for the pension contributions of the quasi-governmental organizations including health departments, community mental health centers and universities and community colleges. These organizations are vehicles for vital state services that lack adequate alternative options for generating the needed funds, and their costs are high in large part because of the state underfunding of pension contributions in the past.
In addition, the most important action Kentucky can take for its pension plans besides making the actuarially determined contributions is to hire new employees and give raises to existing employees. A problem with Kentucky’s pension plans has been declining or stagnant payroll as the state has reduced its workforce primarily through attrition and not given raises to state employees. Hiring new employees and giving raises will strengthen the pension plans through improved cash flow from greater employer and employee contributions. The lifeblood of a pension plan is new, younger employees who pay into the pension plan but will not draw benefits for decades to come.
Non-transportation infrastructure
The federal Infrastructure Investment and Jobs Act will help move Kentucky forward
The bipartisan Infrastructure Investment and Jobs Act, which passed in early November 2021, includes much-needed new investments in modernizing Kentucky’s physical infrastructure.178 The law funds a broad array of priorities foundational to the ability of communities to thrive, including roads, bridges, broadband, public transit, airports, ports, cleanup of abandoned mines and wells, electric vehicle charging stations, Amtrak, cybersecurity, removal of lead pipes and more. Benefits to Kentucky besides those relating to transportation, which will be discussed below, includes a minimum of $100 million to improve broadband access, including for the estimated 5.1% of Kentuckians who currently live in areas where there is no broadband infrastructure, and 17% of Kentuckians who do not have an internet service subscription.179 In addition, approximately 1.5 million Kentuckians will qualify for the bill’s Affordable Connectivity Benefit to help make internet access more affordable.180 This program will provide up to $30 a month toward the cost of broadband for households living below 200% of the federal poverty line.181
The law also includes significant monies to create jobs by cleaning up long-standing environmental hazards. It includes $1.4 billion in competitive grants to address abandoned oil and gas wells. The number of such wells in Kentucky is over 115,000, which cause serious health and safety risks and leak greenhouse gas emissions.182 There is also $1.5 billion for brownfields reclamation to help address Kentucky’s 8,000 brownfield sites, which are previously developed properties that are not currently being used, and may be contaminated.183 And there is $11.2 billion for abandoned mine reclamation. Kentucky ranks 3rd in the nation with 34,402 acres of unreclaimed mine sites, and will receive an estimated $1.1 billion over 15 years for reclamation.184 Until cleaned up, these sites present a continuing danger for people who live around them.
Kentucky’s transportation infrastructure
Kentucky maintains the 7th-largest bridge network and has the 8th-largest pavement network in the country.185 Furthermore, a large number of the nation’s bridges that need inspection and repair are in Kentucky.186 Because the state has underinvested in maintaining roads and bridges for many years, there are currently over $2 billion in unfunded needs for pavement and bridge repair.187
The Infrastructure Investment and Jobs Act provides over $1.2 trillion in funding over 10 years for a wide variety of transportation infrastructure projects. Kentucky is expected to receive around $4.6 billion for road improvements and $438 million for bridge replacement and repair — funds that will help address the 1,033 bridges and 1,322 miles of highway in Kentucky that are in poor condition — but that will also require a state match.188 There is also $69 million for Kentucky to complete the portion of the Appalachian Development Highway System (a network of roads that connects Appalachia to interstate highways).189 This amount represents an average of $200 million more per fiscal year than Kentucky has been receiving in federal highway funding for these purposes.190 In addition, Kentucky will receive $391 million for public transportation. The legislation also includes a competitive $12.5 billion Bridge Investment Program, which Kentucky can apply for to assist with replacement of the Brent Spence Bridge that connects Kentucky and Ohio and construction of the I-69 bridge.191
At the state level, Kentucky’s Road Fund is the primary source of state funds for road construction and maintenance, airports, and public transportation. It was initially hit hard by COVID-19, ending the 2020 fiscal year down 4.8% compared to the prior year, or $74 million short with all accounts experiencing reductions.192 In FY 2021, the Road Fund rebounded with revenues up by 10.1%, exceeding the official estimate by $64.6 million.193 The total Road Fund surplus was $97.3 million, which was transferred to the State Highways Construction Account. Despite the rebound, annual revenues remain far short of what is necessary to begin to meet the infrastructure needs of the commonwealth. The latest infrastructure report card from the American Society of Civil Engineers notes: “KYTC has a demonstrated need for pavement preservation, rehabilitation, and replacement of $4.5 billion over the next 10 years. However, at current funding levels, only $3.2 billion will be available.”194 Additional transportation funding is supported by KICKstartKY, a broad coalition of over 40 business and government organizations, and comprehensive funding proposals have been introduced in the past several sessions but have not yet advanced.195
The forecasts adopted by the CFG for 2023 and 2024 anticipate $39.8 million in new revenues for 2023 with total receipts of $1.72 billion, and a reduction in revenues of $43 million for 2024 with total receipts of 1.67 billion.196
Federal funding and state surpluses present historic opportunity to invest in Kentucky
Kentucky is set to receive a second payment of $1.1 billion from the ARPA State Fiscal Recovery Fund in 2022 at a time when pandemic-related hardship remains high.197 Relief to low-income Kentuckians hurting the most from the ongoing pandemic should be the primary use of these funds, unlike in the first tranche where nearly half the dollars went to pay off Kentucky’s unemployment loan in order to cut business taxes. In early October, 16% of Kentuckians reported having lost household income over the past month, 29% said they had difficulty paying for usual household expenses over the past week, 28% of renters were not confident they could make their next payment and 13% of households with kids said they didn’t have enough food for their children.198
Kentucky could use these dollars to provide direct cash payments to families who have participated in the time-limited K-TAP program since the beginning of the pandemic. Additionally, as the maximum benefit awards for SNAP participants are set to expire next year, these funds could be used to help phase down those extra food benefits, rather than allow them all to expire at once. Other ways to alleviate hardship could include seeding Kentucky’s Affordable Housing Trust Fund to help preserve and create more affordable housing options throughout the state. And Kentucky should use a portion of these funds to provide so-called “Hero Bonuses” to essential workers who are often paid little while expected to bear the most risk of COVID-19 infections.
There is still a possibility, too, that the Build Back Better Act will pass Congress and present the Kentucky General Assembly with transformational opportunities. Particularly relevant for state government are proposals to offer universal preschool for 3 and 4 year olds, vastly expanded child care assistance and provide more resources for Medicaid home and community based services. Depending on the final version of the bill, the state may need to provide a modest match and may need to decide on participation in 2022. Kentucky should not miss the opportunity to fully maximize far-reaching opportunities for the state’s children, seniors and economy.
The General Assembly will also decide how to spend a massive General Fund surplus this year. As mentioned previously, it is estimated that surpluses by the end of FY 2022 will bring the BRTF to a historical high of $3.4 billion, or 28.4% of the General Fund. This far exceeds any previous rainy day fund balance, and exceeds what is needed to ensure fiscal security in the event of future downturns and other shocks. Leaving the equivalent of 5% of the General Fund in the BRTF (the highest level in the past 30 years), and working over the next several budget cycles to bring the balance up to 15%, would allow the General Assembly in 2022 to reinvest in the many needs laid out in this report.199 From K-12 education to home and community based services to child welfare and more, state government had yet to recover from the Great Recession, even before the additional challenges of COVID-19. Additional spending for tornado relief—especially for low-income western Kentuckians as well as for local public services that will be hit by loss of property tax revenues—is a new priority that should be considered with these one-time funds.
It would be a devastating mistake to waste this once-in-a-generation surplus on uses that do not help address the deep backlog of public service needs and the serious demand in our communities for pandemic-related relief. Kentucky should not put too much in the BRTF at the expense of immediate needs or provide excessive pension contributions, which are on a stable trajectory toward financial health. Similarly, Kentucky has already paid the debt businesses owe to the U.S. Treasury for a loan taken to pay unemployment benefits during the worst of the downturn, and with steady contributions coming in now, there is no need to deposit more badly needed public resources into the trust fund. And critically, more tax cuts for the wealthy and corporations, on top of the hundreds of millions that have been given away in recent years, would be a harmful waste of the opportunity in the 2022-2024 Budget of the Commonwealth. People and businesses base decisions about where to locate on factors other than taxes, and more cuts would eat into tax revenue going forward that is needed to pay for things like education and infrastructure that make Kentucky a good place to live and work. Tax cuts would create even deeper crises in public services in the future, a path Kentucky cannot afford, and force lawmakers to reverse such cuts in the eventual likely finding that the state is failing to uphold its constitutional duties.
- Office of State Budget Director, “Commonwealth of Kentucky Quarterly Economic & Review Report Fourth Quarter Fiscal Year 2021,” July 30, 2021, https://osbd.ky.gov/Publications/Quarterly%20Economic%20and%20Revenue%20Reports%20%20Fiscal%2017/21-4thQrtRevenue.pdf.
- John Hicks, “End of Year Presentation to Appropriations and Revenue Committee,” Office of the State Budget Director, Aug. 4, 2021, https://osbd.ky.gov/Publications/Documents/Presentations/FY%2021%20Year-End%20Financial%20Report%20Presentation%20to%20the%20Interim%20Joint%20Committee%20on%20Appropriations%20and%20Revenue%20-%20August%204%2c%202021.pdf.
- Hicks, “End of Year Presentation to Appropriations and Revenue Committee.”
- Consensus Forecasting Group (CFG), official revenue estimates for the General Fund and Road Fund for FY 2022-2024, conveyed via letter to John T. Hicks, State Budget Director, conveying December 22, 2021, https://osbd.ky.gov/Publications/Documents/Official%20Revenue%20Estimates/2022-24%20Official%20CFG%20Revenue%20Estimates.pdf.
- Hicks, “End of Year Presentation to Appropriations and Revenue Committee.” Office of State Budget Director, “General and Road Fund Receipts Reported for Fiscal Year 2021,” July 9, 2021, https://osbd.ky.gov/Publications/Tax%20Receipt%20Reports%20%20Fiscal%20Year%202021/2106TaxReceipt.pdf.
- CFG official revenue estimates for the General Fund and Road Fund for FY 2022-2024.
- Hicks, “End of Year Presentation to Appropriation and Revenue Committee.”
- CFG official revenue estimates for the General Fund and Road Fund for FY 2022-2024. It should be noted that the corporate taxes also include banks for the first time after repeal of the bank franchise tax and movement of banks to the corporate taxes. The overall shift from payment of the bank franchise tax to the corporate income taxes was projected to be a net loss of over $100 million a year to the General Fund.
- Kentucky Department of Revenue, “State Real Property Tax Rate Discussion,” presentation to the Interim Joint Committee on Appropriations and Revenue, Sept. 8, 2021, https://apps.legislature.ky.gov/CommitteeDocuments/10/13590/Sep%2024%202021%20DOR%20State%20Real%20Property%20Tax%20Rate%20for%20IJC%20A%20&%20R.pdf. Kentucky Department of Revenue, “2021 State Real Property Tax Rate Drops to 11.9 Cents,” July 6, 2021, https://revenue.ky.gov/News/Pages/2021-State-Real-Property-Tax-Rate-Drops-to-11.9-Cents.aspx.
- Hicks, “End of Year Presentation to Appropriation and Revenue Committee.”
- Office of State Budget Director, “Commonwealth of Kentucky Quarterly Economic & Review Report Fourth Quarter Fiscal Year 2021.
- CFG official revenue estimates for the General Fund and Road Fund for FY 2022-2024.
- Greg Harkenrider, “CFG Preliminary Estimates, Introductory Amounts and Receipts Updates,” presentation to the Consensus Forecasting Group, Oct. 14, 2021, https://apps.legislature.ky.gov/CommitteeDocuments/209/13589/2%20-%20CFG%20Introduction%20Presentation%20Oct%2014%202021.pdf
- CFG official revenue estimates for the General Fund and Road Fund for FY 2022-2024.
- Hicks, “End of Year Presentation to Appropriation and Revenue Committee.”
- Jason Bailey, “Historic Surplus Leaves State in Strong Place to Begin Reinvesting in Kentucky’s Needs,” Kentucky Center for Economic Policy, Aug. 4, 2021, https://kypolicy.org/historic-surplus-leaves-ky-in-strong-place-to-invest-in-state-needs/.
- Elizabeth C. McNichol and Ed Lazere, “States Should Improve the Design of Their Rainy Day Funds,” Center on Budget and Policy Priorities, June 3, 2021, https://www.cbpp.org/research/state-budget-and-tax/states-should-improve-the-design-of-their-rainy-day-funds.
- The Pew Charitable Trusts, “Rainy Day Funds and State Credit Ratings,” May 2017, https://www.pewtrusts.org/-/media/assets/2017/05/statesfiscalhealth_creditratingsreport.pdf.
- Bailey, “Historic Surplus Leaves State in Strong Place to Begin Reinvesting in Kentucky’s Needs.”
- McNichol and Lazere, “States Should Improve the Design of Their Rainy Day Funds.”
- KyPolicy analysis of data from the Office of State Budget Director.
- Hicks, “End of Year Presentation to Appropriation and Revenue Committee.”
- Office of State Budget Director, Monthly Report on Federal Pandemic Relief Funds, updated through Nov. 30, 2021, as required by House Bill 192, Part III, Section 39, submitted to the Interim Joint Committee on Appropriations and Revenue on Dec. 15, 2021.
- Jason Bailey, “What’s in the CARES Act for Kentucky,” Kentucky Center for Economic Policy, April 3, 2021, https://kypolicy.org/whats-in-the-new-covid-19-relief-bill/. John Hicks, “Federal Pandemic Funds (To and Through Kentucky State Government),” Office of State Budget Director, presentation before the Interim Joint Committee on Appropriations and Revenue, July 7, 2021, https://apps.legislature.ky.gov/CommitteeDocuments/10/13368/Jul%207%202021%20Federal%20Pandemic%20Funds%20-%20OSBD.pdf. Note that amounts that Kentucky would receive, referenced in this piece, were subsequently reduced based on a drop in Kentucky’s unemployment rate.
- Bailey, “What’s in the CARES Act for Kentucky.”
- Hicks, “Federal Pandemic Funds (To and Through Kentucky State Government).”
- U.S. Department of the Treasury, “Coronavirus State and Local Fiscal Recovery Funds,” https://home.treasury.gov/policy-issues/coronavirus/assistance-for-state-local-and-tribal-governments/state-and-local-fiscal-recovery-funds. For information about actual distributions to non-entitlement cities based on applications received, see “Governor Beshear Announces $157 million in Funding for City Governments Across Kentucky,” July 22, 2021, https://kentucky.gov/Pages/Activity-stream.aspx?n=GovernorBeshear&prId=886. Ed Lazere, “How States Can Best Use Federal Fiscal Recovery Funds: Lessons From State Choices So Far,” Center on Budget and Policy Priorities, Nov. 29, 2021, https://www.cbpp.org/research/state-budget-and-tax/how-states-can-best-use-federal-fiscal-recovery-funds-lessons-from.
- Lazere, “How States Can Best Use Federal Fiscal Recovery Funds: Lessons From State Choices So Far.”
- Pam Thomas, “Small Tax Breaks’ Costs Add Up Over Time,” Kentucky Center for Economic Policy, Sept. 8, 2017, https://kypolicy.org/small-tax-breaks-costs-add-time/.
- KyPolicy analysis of data from the Office of State Budget Director and Bureau of Economic Analysis.
- The 2021-2022 budget also includes $80.7 million in fund transfers and $27 million in lapses needed to help make ends meet as a result of Kentucky’s structural deficit caused by our broad array of tax expenditures.
- Jason Bailey, “Corporations Were the Primary Focus of One-Time Monies in the General Assembly,” Kentucky Center for Economic Policy, April 12, 2021, https://kypolicy.org/corporations-were-primary-focus-of-one-time-monies-in-general-assembly/.
- Office of State Budget Director, “Commonwealth of Kentucky Quarterly Economic & Review Report Fourth Quarter Fiscal Year 2021.” Office of State Budget Director, “2021-2022 Budget of the Commonwealth,” Budget in Brief, https://osbd.ky.gov/Publications/Documents/Budget%20Documents/2021-2022%20Budget%20of%20the%20Commonwealth/2021-2022%20Budget%20in%20Brief%20-%20FINAL.pdf.
- 2021 RS Ky. Acts Ch. 3, https://apps.legislature.ky.gov/law/acts/21SS/documents/0003.pdf. Morgan Watkins, “What to Know About Ford’s $5.8B, 5,000-Job Battery Park in Hardin County, Kentucky,” Courier-Journal, Sept. 28, 2021, https://www.courier-journal.com/story/news/2021/09/28/what-to-know-about-fords-new-battery-park-kentucky/5890741001/.
- Office of State Budget Director, “Commonwealth of Kentucky Tax Expenditure Analysis Fiscal Years 2022-2024,” Nov. 30, 2021, https://osbd.ky.gov/Publications/Documents/Special%20Reports/Tax%20Expentiture%20Report%2022-24.pdf. Note that the totals reflected here include Tourism Development Act and Tax Increment Financing expenditures, which were excluded from the grand totals reported by the Office of State Budget Director in the executive summary of the report.
- Office of State Budget Director, “Commonwealth of Kentucky Tax Expenditure Analysis Fiscal Years 2022-2024.”
- Bailey, “Historic Surplus Leaves State in Strong Place to Begin Reinvesting in Kentucky’s Needs.”
- Barb Rosewicz, Justin Theal and Alexandre Fall, “States’ Tax Revenue Recovery Improves at Start of 2021,” Pew Fiscal 50: State Trends and Analysis, Oct. 14, 2021, https://www.pewtrusts.org/en/research-and-analysis/data-visualizations/2014/fiscal-50#ind0.
- A swap from income taxes to consumption taxes significantly shifts who pays for public services. Low- and middle-income people spend all or most of their income, with little left for savings, resulting in a larger share of their income being spent on items that are subject to the sales tax. In contrast, those at the top are able to save a significant portion of their income, making the sales tax less significant to their family budgets. In addition, Kentucky has exempted people below the poverty line from the income tax since a “family size credit” was enacted. So further cuts to the income tax in exchange for higher sales taxes harm people with incomes under the poverty line the most because they receive no benefit from an income tax decrease, while they feel the biggest impact of higher sales taxes.
- Jason Bailey, “Further Shift Away from Income Taxes Would Worsen Inequalities, Harm State’s Economy,” Kentucky Center for Economic Policy, Dec. 10, 2021, https://kypolicy.org/further-shift-away-from-income-taxes-in-kentucky-would-worsen-inequities-harm-state-economy/.
- Federation of Tax Administrators, “State Sales Tax Rates and Food & Drug Exemptions,” as of Jan. 1, 2021, https://www.taxadmin.org/assets/docs/Research/Rates/sales.pdf.
- Anna Baumann, “New Report: Wealthiest Kentuckians Pay the Lowest Tax Rate and the Problem Is Worsening,” Kentucky Center for Economic Policy, Oct. 17, 2018, https://kypolicy.org/new-report-wealthiest-kentuckians-pay-the-lowest-tax-rate-and-the-problem-is-worsening/.
- Office of State Budget Director, “2021-2022 Budget of the Commonwealth.”
- Kentucky Department of Education, presentation to Interim Joint Budget Review Subcommittee on Education, July 7, 2021, https://apps.legislature.ky.gov/CommitteeDocuments/11/. ESSER funds can be used: 1) To address needs arising from the COVID-19 pandemic including the needs of children from low-income families, children with disabilities, students of color, students experiencing homelessness and youth in foster care. 2) For strategies to implement public health protocols in line with guidance from the Centers for Disease Control and Prevention (CDC) on reopening and operating schools to effectively maintain health and safety; this includes improving indoor air quality, training staff, purchasing educational technology, providing mental health services and supports, activities related to summer learning and supplemental after-school programs. GEER funds are allocated by governors to provide emergency support to educational institutions. The majority of Kentucky’s GEER I funds went to school districts for technology and nutrition needs, and a portion went to higher education.
- Kentucky School Facilities Construction Commission, presentation to Interim Budget Review Subcommittee on Education, Sept. 8, 2021, https://apps.legislature.ky.gov/CommitteeDocuments/11/.
- School Facilities Construction Commission, personal communication, Dec. 9, 2021.
- Andy Beshear, letter to President Stivers and Speaker Osborne, Nov. 19, 2021, https://apps.legislature.ky.gov/CommitteeDocuments/33/13493/11-19-2021%20gov%20response%20to%20senate%20president%20and%20speaker.pdf.
- 2021 RS Ky. Acts Ch. 169, https://apps.legislature.ky.gov/law/acts/21RS/documents/0169.pdf. The amount that school districts receive under SEEK is in part determined by student attendance. Because of the impact of COVID-related school closures and disruptions that significantly impacted attendance for most schools, the General Assembly authorized school districts to use attendance data from 2018-2019 or 2019-2020 for 2021 rather than actual attendance, as it did the past two years, so that school funding is not impacted by COVID-related attendance issues. 2021 RS Ky. Acts Ch. 4, https://apps.legislature.ky.gov/law/acts/21SS/documents/0004.pdf.
- KyPolicy analysis of Office of State Budget Director data.
- KyPolicy analysis of Office of State Budget Director data.
- Anna Baumann, “Inequality Between Rich and Poor Kentucky School Districts Grows Again Even as Districts Face New COVID Costs and Looming Revenue Losses,” Kentucky Center for Economic Policy, Sept. 2, 2020, https://kypolicy.org/new-analysis-inequality-between-rich-and-poor-kentucky-school-districts-grows-again-even-as-districts-face-new-covid-costs-and-looming-revenue-losses/.
- Ashley Spalding, “State Budget Cuts to Education Hurt Kentucky’s Classrooms and Kids,” Kentucky Center for Economic Policy, January 2018, https://kypolicy.org/state-budget-cuts-education-hurt-kentuckys-classrooms-kids/.
- KyPolicy analysis of Office of State Budget Director data.
- Kentucky Department of Education, presentation to the Budget Review Subcommittee on Education, July 7, 2021. Claudette Enriquez, “Gov. Andy Beshear Awards $15 Million in Grants to Help Kentucky Local Family Resource and Youth Services,” WYMT, July 1, 2021, https://www.wymt.com/2021/07/01/gov-andy-beshear-awards-15-million-grants-help-kentucky-local-family-resource-youth-services/. KyPolicy analysis of Office of State Budget Director data.
- Office of State Budget Director, “2021-2022 Budget of the Commonwealth.”
- 2021 RS Ky. Acts Ch. 196, https://apps.legislature.ky.gov/law/acts/21RS/documents/0196.pdf.
- Sabrina Olds et al., “Preschool Program Review and Full-Day Kindergarten,” Office of Education Accountability, July 10, 2018, https://apps.legislature.ky.gov/lrc/publications/ResearchReports/RR450.pdf. Spalding, “State Budget Cuts to Education Hurt Kentucky’s Classrooms and Kids.” Testimony by superintendents, Interim Budget Review Subcommittee on Education Meeting, Sept. 24, 2021. Ashley Spalding, Anna Baumann and Pam Thomas, “School Funding Task Force Recommendations Include Steps Toward Adequacy and Equity,” Nov. 12, 2021, https://kypolicy.org/school-funding-task-force-recommendations-include-steps-toward-adequacy-and-equity/.
- 2021 RS Ky. Acts Ch. 176, https://apps.legislature.ky.gov/law/acts/21RS/documents/0176.pdf. School Funding Task Force, “School Funding Task Force (HB 405),” June 14, 2021, https://apps.legislature.ky.gov/CommitteeDocuments/351/13516/Task%20Force%20Scope.pdf.
- School Funding Task Force, Memorandum, Nov. 8, 2021, https://apps.legislature.ky.gov/CommitteeDocuments/351/13521/DRAFT%20-%20School%20Funding%20Task%20Force%20-%20Co-Chair%20Recommendations%20memo.pdf.
- Ashley Spalding, “Critical Investments for a Healthier Kentucky,” Kentucky Center for Economic Policy, June 3, 2019, https://kypolicy.org/critical-investments-for-a-healthier-kentucky/.
- Christopher Jepsen, Kenneth Troske and Casey Brasher, “Estimates of the Costs and Benefits of Expanding the Early Childhood Education Program in Kentucky,” Center for Business and Economic Research, Oct. 5, 2009, https://uknowledge.uky.edu/cber_researchreports/5/. There is a substantial body of research that shows a high return on investment for high-quality early childhood education. Jorge Luis García, James J. Heckman, Duncan Ermini Leaf and María José Prados, “The Life-cycle Benefits of an Influential Early Childhood Program,” National Bureau of Economic Research, 2016, https://www.nber.org/papers/w22993.
- Allison Friedman-Krauss, W. Steven Barnett and Milagros Nores, “How Much Can High-Quality Universal Pre-K Reduce Achievement Gaps?,” Center for American Progress, April 2016, https://nieer.org/wp-content/uploads/2017/01/NIEER-AchievementGaps-report.pdf.
- Kentucky Department of Education, “Preschool/Primary,” https://education.ky.gov/curriculum/conpro/prim-pre/Pages/default.aspx. KyPolicy analysis of 2021 Federal Poverty Guidelines from the U.S. Department of Health and Human Services, https://aspe.hhs.gov/poverty-guidelines.
- Kentucky Department of Education, “Draft Budget and Policy Priorities for the 2018 Regular Session.”
- Sabrina Olds et al, “Preschool Program Review and Full-Day Kindergarten.”
- Jacqueline Thompson, “KBE Approves 2022-2024 Biennial Budget Request, Sets Annual Goals,” Kentucky Teacher, Oct. 5, 2021, https://www.kentuckyteacher.org/news/2021/10/kbe-approves-2022-2024-biennial-budget-request-sets-annual-goals/.
- Center for American Progress, “Do You Live in a Child Care Desert?,” accessed Oct. 25, 2021, https://childcaredeserts.org/2018/?state=KY.
- Dustin Pugel, “Child Care in Kentucky Is Crucial and in Dire Need of Public Investment,” Kentucky Center for Economic Policy, Nov. 11, 2021, https://kypolicy.org/report-child-care-in-kentucky-is-crucial-and-needs-public-investment/.
- Data from an open records request to the Kentucky Division of Child Care for July 2021 received on Sept. 20, 2021.
- Office of State Budget Director, “2016-2018 Budget of the Commonwealth,” April 2016, https://osbd.ky.gov/Publications/Documents/Budget%20Documents/2016-2018%20Budget%20of%20the%20Commonwealth/BOC%20Appropriation%20Bills%20-%207-1-16.pdf. Office of the State Budget Director, “2021-2022 Budget of the Commonwealth.” U.S. Department for Health and Human Services, 2021 Poverty Guidelines, https://aspe.hhs.gov/topics/poverty-economic-mobility/poverty-guidelines/prior-hhs-poverty-guidelines-federal-register-references/2021-poverty-guidelines.
- 2021 RS Ky, Acts Ch. 176, https://apps.legislature.ky.gov/law/acts/21RS/documents/0176.pdf.
- Kentucky Cabinet for Health and Family Services, “Kentucky Child Care Maximum Payment Rate Chart: DCC-300,” https://chfs.ky.gov/agencies/dcbs/Documents/dcc300kymaxpayment.pdf.
- Cory Curl, “Building Blocks: The Kentucky Early Childhood Cost of Quality Study,” Prichard Committee, November 2017, http://www.prichardcommittee.org/library/wp-content/uploads/2017/11/Cost-of-Quality-Brief-November-2017.pdf. Center on the Developing Child, “The Science of Early Childhood Development (InBrief),” Harvard University, 2007, https://developingchild.harvard.edu/resources/inbrief-science-of-ecd/. Taryn Morrissey, “The Effects of Early Care and Education on Children’s Health,” Health Affairs, Apr. 25, 2019, https://www.healthaffairs.org/do/10.1377/hpb20190325.519221/full/.
- Simon Workman, “The True Cost of High-Quality Child Care Across the United States,” Center for American Progress, June 2021, https://cdn.americanprogress.org/content/uploads/2021/07/07075937/True-Cost-of-High-Quality-Child-Care.pdf.
- Kentucky Division of Child Care, “The State of Kentucky Child Care: COVID-19 Response Resources for Providers and Families,” November 2020, https://chfs.ky.gov/agencies/dcbs/dcc/Documents/childcareupdatenov23.pdf. Office of Governor Andy Beshear, “Gov. Beshear Provides Update on COVID-19,” Oct. 7, 2020, https://chfs.ky.gov/News/Documents/nrcaresact.pdf. Alycia Hardy and Katherine Gallagher Robbins, “Child Care Relief Funding in the Year-End Stimulus Deal: A State-by-State Estimate,” The Center for Law and Social Policy, Dec. 22, 2020, https://www.clasp.org/publications/fact-sheet/covid-relief-stimulus-child-care-state-estimates. Bobbi McSwine, “Kentucky Lays Out Plan for Child Care Funding,” WTVQ, Feb. 3, 2021, https://www.wtvq.com/2021/02/03/kentucky-lay-out-plan-for-child-care-funding/. Eric Friedlander, “Kentucky Receives $195.5 Million in Federal Child Care Aid,” Kentucky Cabinet for Health and Family Services, Mar. 5, 2021, https://chfs.ky.gov/News/Documents/nrchildcareaid.pdf.
- Sarah Vanover, “American Rescue Plan Act (ARPA) Funding for Child Care,” Division of Child Care, presentation to the Interim Joint Budget Review Subcommittee on Human Resources on Aug. 4, 2021, https://apps.legislature.ky.gov/CommitteeDocuments/12/13397/Aug%204%202021%20Vanover%20ARPA%20Funding%20PowerPoint.pdf.
- Ashley Spalding, “Kentucky Among Worst States in Nation for Higher Education Cuts, Harming Students Who Already Face the Greatest Barriers,” Kentucky Center for Economic Policy, Feb. 17, 2021, https://kypolicy.org/kentucky-among-worst-states-in-nation-for-higher-education-cuts/.
- KyPolicy analysis of Office of State Budget Director data.
- Kentucky Council on Postsecondary Education, “Executive Committee,” Aug. 18, 2021, http://cpe.ky.gov/aboutus/records/exec_committee/agenda-2021-08-18-ec.pdf.
- 2021 RS Ky. Acts Ch. 169, https://apps.legislature.ky.gov/law/acts/21RS/documents/0169.pdf. The 2% increase does not take into account the $20 million decrease in 2021 where state funds were supplanted by Coronavirus Relief funds.
- Kentucky Council on Postsecondary Education, “Business Meeting,” Sept. 14, 2021, http://cpe.ky.gov/aboutus/records/cpe_meetings/agenda-2021-09-14-bm.pdf.
- Kentucky Council on Postsecondary Education, “Distribution of 2021-22 Postsecondary Education Performance Fund,” letter to Mr. John Hicks, State Budget Director, May 14, 2021.
- 2021 RS Ky. Acts Ch. 39, https://apps.legislature.ky.gov/law/acts/21RS/documents/0039.pdf. Debt service on bonds and appropriations for mandated programs in 2021 are excluded from the calculated floor.
- Council on Postsecondary Education, “Business Meeting,” May 13, 2021, http://cpe.ky.gov/aboutus/records/cpe_meetings/agenda-2021-05-13.pdf.
- Spalding, “Kentucky Among Worst States in Nation for Higher Education Cuts, Harming Students Who Already Face the Greatest Barriers.”
- Spalding, “Kentucky Among Worst States in Nation for Higher Education Cuts, Harming Students Who Already Face the Greatest Barriers.”
- Spalding, “Kentucky Among Worst States in Nation for Higher Education Cuts, Harming Students Who Already Face the Greatest Barriers.”
- Kentucky Higher Education Assistance Authority, presentation to the Interim Joint Budget Review Subcommittee on Education, Aug. 4, 2021, https://apps.legislature.ky.gov/CommitteeDocuments/11/. Elizabethtown Community and Technical College, “Cost of Attendance,” https://elizabethtown.kctcs.edu/affording-college/cost-of-attendance.aspx.
- U.S. Department of Education, “2021-2022 Federal Pell Grant Payment and Disbursement Schedules,” Jan. 22, 2021, https://fsapartners.ed.gov/knowledge-center/library/dear-colleague-letters/2021-01-22/2021-2022-federal-pell-grant-payment-and-disbursement-schedules.
- Kentucky Council on Postsecondary Education, “Finance Committee Meeting,” Sept. 2, 2021, http://cpe.ky.gov/aboutus/records/finance_committee/agenda-2021-09-02-fc.pdf.
- Ashley Spalding, “Student Debt Forgiveness Would Benefit Hundreds of Thousands of Kentuckians, Help With Economic Recovery and Improve Race Equity,” Kentucky Center for Economic Policy, April 6, 2021, https://kypolicy.org/student-debt-forgiveness-would-benefit-hundreds-of-thousands-of-kentuckians-help-with-economic-recovery-and-improve-race-equity/.
- U.S. Department of Education, “Biden-Harris Administration Extends Student Loan Pause Through May 1, 2022,” Dec. 22, 2021, https://www.ed.gov/news/press-releases/biden-harris-administration-extends-student-loan-pause-through-may-1-2022.
- Spalding, “Student Debt Forgiveness Would Benefit Hundreds of Thousands of Kentuckians, Help With Economic Recovery and Improve Race Equity.”
- Kentucky Council on Postsecondary Education, “Financial Committee Meeting,” May 11, 2021, http://cpe.ky.gov/aboutus/records/finance_committee/agenda-2021-05-11-fc.pdf.
- Kentucky Council on Postsecondary Education, “Finance Committee Meeting,” June 23, 2021, http://cpe.ky.gov/aboutus/records/finance_committee/agenda-2021-06-23-fc.pdf. A summary of these federal funds per institution is provided in the Sept. 2, 2021 “Finance Committee” meeting materials.
- Kentucky Council on Postsecondary Education, “Business Meeting,” Sept. 14, 2021. “Additional operating funds that will provide incentives for institutions to increase student success and course completion outcomes. If authorized, these funds will help Council and campus officials maintain affordability and access for Kentucky citizens and provide resources necessary for institutions to continue making progress toward the state’s student success goals. The request represents increases of 7.4% and 9.9%, respectively, above the current year net General Fund base.”
- Kentucky Council on Postsecondary Education, “Finance Committee Meeting,” Sept. 2, 2021. Kentucky Council on Postsecondary Education, “Higher Ed Budget Request Prioritizes Affordability, Facilities Preservation,” Nov. 5, 2021, http://cpe.ky.gov/news/stories/higher-ed-budget-request-prioritizes.html.
- KyPolicy analysis of the 2022 Budget of the Commonwealth.
- KyPolicy analysis of 2013 and 2019 American Community Survey 1-year estimates.
- Kentucky Department of Medicaid Services, “LRC Medicaid History Report, accessed through open records request received on Oct. 14, 2021.
- Lisa Lee and Steve Bechtel, “Budget Overview for the Department for Medicaid Services,” Kentucky Cabinet for Health and Family Services, Sept. 8, 2021, https://apps.legislature.ky.gov/CommitteeDocuments/12/13417/Sept%208%202021%20Lee%20Medicaid%20PowerPoint.pdf.
- Congressional Research Service, “Medicaid’s Federal Medical Assistance Percentage,” July 29, 2020, https://sgp.fas.org/crs/misc/R43847.pdf.
- Federal Register Vol. 85, No. 230, Nov. 30, 2020, https://www.govinfo.gov/content/pkg/FR-2020-11-30/pdf/2020-26387.pdf.
- KyPolicy analysis of data from “LRC Medicaid History Report,” Kentucky Department of Medicaid Services. Combined state and federal spending on Traditional Medicaid in FY 2021 was $9.7 billion, 6.2% of which is $601.3 million.
- Cynthia Cox et. al., “Potential Costs and Impact of Health Provisions in the Build Back Better Act,” Kaiser Family Foundation, Nov. 23, 2021, https://www.kff.org/health-reform/issue-brief/potential-costs-and-impact-of-health-provisions-in-the-build-back-better-act/#three.
- Lee and Bechtel, “Budget Overview for the Department for Medicaid Services.”
- Lisa Lee and Pam Smith, “Michelle P./SCL Waiver Updates and HB 183 21RS Implementation,” Kentucky Cabinet for Health and Family Services, June 2, 2021, https://apps.legislature.ky.gov/CommitteeDocuments/12/13338/Jun%202%202021%20Lee%20Medicaid%20PowerPoint.pdf.
- Kentucky Department of Medicaid Services, “LRC Medicaid History Report.”
- Cox et al, “Potential Costs and Impact of Health Provisions in the Build Back Better Act.”
- Lee and Smith, “Michelle P./SCL Waiver Updates and HB 183 21RS Implementation.”
- Pam Smith, “1915(c) Home and Community Based Services (HCBS) Task Force: Amending Kentucky’s 1915(c) HCBS Waivers,” testimony to the 1915c Home & Community Based Services Waiver Redesign Task Force on Aug. 23, 2021, https://apps.legislature.ky.gov/CommitteeDocuments/348/13524/August%2023%20DMS%20Needed%20Waiver%20Updates%20Presentation.pdf.
- Lee and Smith, “Michelle P./SCL Waiver Updates and HB 183 21RS Implementation.”
- Steve Shannon, Amy Staed and Jane Stahl, “Waiver Services Reimbursement Rate Changes: Recommendations for Changes from the Perspective of Providers,” testimony to the 1915c Home & Community Based Services Waiver Redesign Task Force, Oct. 18, 2021, https://apps.legislature.ky.gov/CommitteeDocuments/348/13526/10%2018%202021%201915c%20Coalition%20Recommentation.pdf.
- Steve Shannon and Sheila Schuster, “HCB Waiver for Individuals with a Serious Mental Illness,” testimony to the Medicaid Oversight and Advisory Committee, Oct. 26, 2021, https://apps.legislature.ky.gov/CommitteeDocuments/137/13569/10%2026%2021%20SMI%20Waiver%20for%20MOAC%20-%20Schuster%20%20Shannon.pdf.
- Lisa Lee, “Initial Enhanced HCBS Spending Plan and Narrative,” Kentucky Department for Medicaid Services, Jul. 12, 2021.
- Cara Kelly, “Child Maltreatment 2019,” U.S. Department for Health and Human Services, Jan. 14, 2021, https://www.acf.hhs.gov/cb/report/child-maltreatment-2019.
- Marta Miranda-Straub and Lesa Dennis, “DCBS Workforce Challenges and Initiatives,” Kentucky Department for Community Based Services, Oct. 13, 2021, https://apps.legislature.ky.gov/CommitteeDocuments/320/13455/10%2013%202021%20Straub%20-%20DCBS%20Presentation.pdf.
- Miranda-Straub and Dennis, “DCBS Workforce Challenges and Initiatives.”
- Alex Acquisto, “’You’re Going to Keep Seeing Us’ Underpaid and Overworked, KY Social Workers Rally,” Lexington Herald-Leader, Nov. 16, 2021, https://www.kentucky.com/news/politics-government/article255865626.html.
- From job listings for Social Service Worker I positions on the Kentucky Personnel Cabinet’s website accessed Oct. 31, 2021, https://kypersonnelcabinet.csod.com/ats/careersite/search.aspx?site=2&c=kypersonnelcabinet.
- Joe Ragusa, “Lawmakers Discuss Social Worker Shortage in Kentucky,” Spectrum News 1, Oct. 1, 2021, https://spectrumnews1.com/ky/louisville/news/2021/10/14/kentucky-social-workers-leaving-in-droves. Miranda-Straub and Dennis, “DCBS Workforce Challenges and Initiatives.”
- Miranda-Straub and Dennis, “DCBS Workforce Challenges and Initiatives.”
- Marta Miranda-Straub and Lesa Dennis, “Building a 21st Century DCBS: Building Capacity to Serve,” Kentucky Department for Community Based Services, Jul. 7, 2021, https://apps.legislature.ky.gov/CommitteeDocuments/12/13367/July%207%202021%20Miranda-Straub%20Social%20Worker%20Powerpoint.pdf.
- Ashley Spalding, “Family First Is an Opportunity to Expand ‘2 Generation’ Approaches to Addressing the Opioid Epidemic in Kentucky,” Kentucky Center for Economic Policy, Aug. 2, 2019, https://kypolicy.org/%20family-first-is-an-opportunity-to-expand-2-generation-approaches-to-addressing-the-opioid-epidemic-in-kentucky/%20.
- Christa Bell, “Moving Upstream: Expansion of Child Welfare Prevention Services,” Kentucky Department of Community Based Services, Aug. 11, 2021, https://apps.legislature.ky.gov/CommitteeDocuments/320/13405/08%2011%202021%20DCBS%20Prevention%20Funding%20and%20Services%20Presentation.pdf.
- Elizabeth Bradley, et al., “Variation in Health Outcomes: The Role of Spending on Social Services, Public Health, And Health Care, 2000-09,” Health Affairs, May 2016, https://www.healthaffairs.org/doi/abs/10.1377/hlthaff.2015.0814?url_ver=Z39.882003&rfr_id=ori%3Arid%3Acrossref.org&rfr_dat=cr_pub%3Dpubmed.
- Kentucky Center for Economic Policy, “What Does Kentucky Value: A Preview of the 2020-2022 Budget of the Commonwealth,” Jan. 2, 2020, https://kypolicy.org/what-does-kentucky-value-a-preview-of-the-2020-2022-budget-of-the-commonwealth/.
- “2019 Drug Overdose Death Rates,” Centers for Disease Control and Prevention Website, accessed on Nov. 1, 2021, https://www.cdc.gov/drugoverdose/data/statedeaths/drug-overdose-death-2019.html.
- Victoria Elridge and Jessica Wayne, “Department for Aging and Independent Living State Guardianship Update,” Kentucky Department for Aging and Independent Living, July 7, 2021, https://apps.legislature.ky.gov/CommitteeDocuments/12/13367/July%207%202021%20Elridge%20Guardianship%20Powerpoint.pdf.
- 2019 American Community Survey 1 year estimates. KyPolicy analysis of Vintage 2016 Age and Gender population projections, Kentucky State Data Center, accessed on Nov. 13, 2019, http://ksdc.louisville.edu/data-downloads/projections/.
- Kentucky Public Pensions Authority, Kentucky Retirement Systems Comprehensive Annual Financial Reports 2012 – 2020, https://kyret.ky.gov/Publications/Pages/Annual-Reports.aspx.
- 2020 RS Ky. Acts Ch. 21, https://apps.legislature.ky.gov/law/acts/20RS/documents/0021.pdf.
- Sara Jo Best, “Kentucky Public Health Transformation,” Kentucky Health Department Association, Aug. 4, 2021, https://apps.legislature.ky.gov/CommitteeDocuments/12/13397/Aug%204%202021%20Best%20Public%20Health%20PowerPoint.pdf.
- Carmen Mitchell, Pam Thomas, Ashley Spalding and Dustin Pugel, “In Decade Since Major Criminal Justice Reform, the Kentucky General Assembly Has Passed Six Times as Many Laws Increasing Incarceration as Decreasing It,” Kentucky Center for Economic Policy, Dec. 9, 2021, https://kypolicy.org/kentucky-general-assembly-has-passed-six-times-as-many-laws-increasing-incarceration-as-decreasing-it-since-2011/.
- J. Acker et al., “Mass Incarceration Threatens Health Equity in America,” Robert Wood Johnson Foundation, Jan. 15, 2019, https://www.rwjf.org/en/library/research/2019/01/mass-incarceration-threatens-health-equity-in-america.html.
- K.M. Blankenship, A.M. Del Rio Gonzalez, D.E. Keene, A.K. Groves and A.P. Rosenberg, “Mass Incarceration, Race Inequality, and Health: Expanding Concepts and Assessing Impacts on Well-Being,” Social Science & Medicine (October 2018), pp. 45-52, https://www.ncbi.nlm.nih.gov/pubmed/30205278. Connor Maxwell and Danyelle Solomon, “Mass Incarceration, Stress, and Black Infant Mortality,” Center for American Progress, June 5, 2018, https://www.americanprogress.org/issues/race/reports/2018/06/05/451647/mass-incarceration-stress-black-infant-mortality/. Ashley Spalding, “How Criminal Justice Reform Would Help Kentucky Kids,” Kentucky Center for Economic Policy, Dec. 22, 2016, https://kypolicy.org/criminal-justice-reform-help-kentucky-kids/.
- J. Acker et al., “Mass Incarceration Threatens Health Equity in America.” The Sentencing Project, “Report of The Sentencing Project to the United Nations Special Rapporteur on Contemporary Forms of Racism, Racial Discrimination, Xenophobia, and Related Intolerance,” March 2018, https://www.sentencingproject.org/wp-content/uploads/2018/04/UN-Report-on-Racial-Disparities.pdf. The Special Project in collaboration with Louisville Metro Center for Health Equity, “Parental Incarceration, Children’s Health, and an Opportunity to Shift the Future,” https://louisvilleky.gov/center-health-equity/document/parentalincarcerationchildrenshealthpdf.
- Mitchell, Thomas, Spalding and Pugel, “In Decade Since Major Criminal Justice Reform, the Kentucky General Assembly Has Passed Six Times as Many Laws Increasing Incarceration as Decreasing It.”
- Spalding, “How Criminal Justice Reform Would Help Kentucky Kids.”
- Annie E. Casey Foundation, “Children Who Had a Parent Who Was Ever Incarcerated,” 2018-2019, https://datacenter.kidscount.org/data/tables/9688-children-who-had-a-parent-who-was-ever-incarcerated.
- Kentucky Justice and Safety Cabinet, presentation to Interim Joint Budget Review Subcommittee on Justice and Judiciary, Sept. 24, 2021, https://apps.legislature.ky.gov/CommitteeDocuments/17/13599/Sept%2024%202021%20Bender%20Corrections%20PowerPoint.pdf.
- Ashley Spalding, Pam Thomas and Dustin Pugel, “The Golden Key: How State-Local Financial Incentives to Lock Up Kentuckians Are Perpetuating Mass Incarceration,” Kentucky Center for Economic Policy, Oct. 21, 2021, https://kypolicy.org/the-golden-key-how-state-local-financial-incentives-to-lock-up-kentuckians-are-perpetuating-mass-incarceration/. Department of Corrections, Weekly Jail Population Report, https://corrections.ky.gov/About/researchandstats/Pages/WeeklyJail.aspx.
- Office of State Budget Director, “2021-2022 Budget of the Commonwealth.”
- Kentucky Department of Corrections, “HB 463 Annual Report 2019,” https://corrections.ky.gov/About/researchandstats/Documents/Annual%20Reports/HB%20463%20Report%202019.pdf. Jessica Klein, “What the Legislature Can Do to Improve the Return Home for Kentuckians Leaving Incarceration,” Kentucky Center for Economic Policy, Dec. 16, 2021, https://kypolicy.org/legislature-can-improve-return-home-for-kentuckians-leaving-incarceration/.
- Ashley Spalding, Carmen Mitchell and Pam Thomas, “The 2021 Legislative Session Criminal Justice Wrap Up,” Kentucky Center for Economic Policy, April 16, 2021, https://kypolicy.org/2021-legislative-session-criminal-justice-wrap-up/.
- Spalding, Mitchell and Thomas, “The 2021 Legislative Session Criminal Justice Wrap Up.” Corrections Impact Statement, 2021 RS HB 126, https://apps.legislature.ky.gov/recorddocuments/note/21RS/hb126/CI.pdf.
- Corrections Impact Statement 2021 RS HB 402, https://apps.legislature.ky.gov/recorddocuments/note/21RS/hb402/SCS1CI.pdf.
- Spalding, Thomas and Pugel, “The Golden Key.”
- Kentucky Department of Public Advocacy, “Over Incarceration,” https://dpa.ky.gov/News-and-Public-Information/issuesinpublicdefense/Pages/Over-Incarceration.aspx.
- Mitchell, Thomas, Spalding and Pugel, “In Decade Since Major Criminal Justice Reform, the Kentucky General Assembly Has Passed Six Times as Many Laws Increasing Incarceration as Decreasing It.”
- Bureau of Justice Statistics, “Prisoners in 2019,” October 2020, https://bjs.ojp.gov/content/pub/pdf/p19.pdf. Department of Corrections “Weekly Jail Population Reports,” https://corrections.ky.gov/About/researchandstats/Pages/WeeklyJail.aspx. For context, states with the highest number of state prison populations housed in county jails other than Kentucky and Louisiana include Mississippi, Utah, Tennessee and Virginia, which all house approximately a quarter of their state prison populations in jail.
- Spalding, Thomas and Pugel, “The Golden Key.”
- Kentucky Department of Corrections, “Cost to Incarcerate – FY21,” https://corrections.ky.gov/About/researchandstats/Documents/Annual%20Reports/Cost%20to%20Incarcerate%202021.pdf.
- Spalding, Thomas and Pugel, “The Golden Key.”
- Ashley Spalding, “Disparate Justice: Where Kentuckians Live Determines Whether They Stay in Jail Because They Can’t Afford Cash Bail,” Kentucky Center for Economic Policy, June 11, 2019, https://kypolicy.org/disparate-justice-where-kentuckians-live-determines-whether-they-stay-in-jail/.
- Spalding, Thomas and Pugel, “The Golden Key.”
- Spalding, Thomas and Pugel, “The Golden Key.”
- 2021 RS Ky. Acts Ch. 194, https://apps.legislature.ky.gov/law/acts/21RS/documents/0194.pdf. Office of State Budget Director, “2021-2022 Budget of the Commonwealth.”
- 2021 RS Ky. Acts Ch. 194, https://apps.legislature.ky.gov/law/acts/21RS/documents/0194.pdf. Office of State Budget Director, “2021-2022 Budget of the Commonwealth.”
- Spalding, Thomas and Pugel, “The Golden Key.”
- Damon Preston and B. Scott West, Department of Public Advocacy, testimony to Interim Budget Review Subcommittee on Justice and Judiciary, Aug. 4, 2021, https://apps.legislature.ky.gov/CommitteeDocuments/17/13394/Aug%204%202021%20Preston%20DPA%20Attorney%20Salaries%20Handout.pdf.
- Budget Review Subcommittee on Justice and Judiciary, “Minutes of the 1st Meeting of the 2021 Interim,” June 2, 2021, https://apps.legislature.ky.gov/CommitteeDocuments/17/13364/July%207%202021%20BR%20JJ%20June%20Minutes.pdf.
- Preston and West, testimony to the Interim Budget Review Subcommittee on Justice and Judiciary.
- Office of State Budget Director, “2021-2022 Budget of the Commonwealth.” OSBD notes difficulty recruiting and retaining sufficient correctional officers and the need for pay raises in the Oldham/Shelby County facilities specifically.
- Budget Review Subcommittee on Justice and Judiciary, “Minutes of the 1st Meeting of the 2021 Interim.”
- Gerina Whethers, “2019-2020 Annual Report,” Kentucky Personnel Cabinet, Feb. 3, 2021, https://personnel.ky.gov/Annual%20Reports/2019-20%20Annual%20Report.pdf. Elise Gould, Zane Mokhiber and Kathleen Bryant, “Family Budget Calculator,” Economic Policy Institute, Mar. 13, 2018, https://www.epi.org/resources/budget/.
- Gerina Whethers, “2019-2020 Annual Report.”
- Bureau of Labor Statistics Quarterly Census of Employment and Wages for all private sector employees in Kentucky adjusted for the state fiscal year 2020 CPI-U.
- According to a 2012 estimate, 51% of full-time Kentucky public sector workers hold at least a four-year college degree compared to 22% of full-time private sector workers. Jeffrey H. Keefe, “Public Versus Private Employee Costs in Kentucky: Comparing Apples to Apples,” Kentucky Center for Economic Policy, July 2012, https://kypolicy.org/public-versus-private-employee-costs-kentucky-comparing-apples-apples-2/.
- Keefe, “Public Versus Private Employee Costs in Kentucky.”
- Current Employment Statistics State and Metro Area Employment, Hours & Earnings for Kentucky in April 2020 and September 2021.
- KyPolicy analysis of data from the 2019-2020 Annual Report of the Kentucky Personnel Cabinet indicating the average annual salary, pension contribution and FICA expenses totaling $82,213 for 33,201 state employees. Ayelet Sheffey, “The US Just Had its Best Quarter for Wage Growth in 20 Years — But Especially for White People,” Business Insider, Apr. 30, 2021, https://www.businessinsider.com/us-jobs-wage-growth-best-quarter-white-people-economy-2021-4.
- Whethers, “2019-2020 Annual Report.”
- Jason Bailey, “Cash Balance Plan Likely to Increase Costs, Impact the Quality of Public Services and Reduce Retirement Security,” Kentucky Center for Economic Policy, Feb. 11, 2013, https://kypolicy.org/cash-balance-plan-likely-increase-costs-impact-quality-public-services-reduce-retirement-security/.
- Kentucky Public Pensions Authority, Board of Trustees meeting materials, Dec. 8, 2021, https://kyret.ky.gov/About/Meeting-Calendar/Materials/December%208%202021%20KPPA%20Meeting%20Material.pdf.
- Jamie Lenney, et al., “The Sustainability of State and Local Government Pensions: A Public Finance Approach,” Brookings, March 24, 2021, https://www.brookings.edu/bpea-articles/the-sustainability-of-state-and-local-government-pensions-a-public-finance-approach/. Tom Sgouros, “Funding Public Pensions: Is Full Pension Funding a Misguided Goal,” Haas Institute, 2018, https://belonging.berkeley.edu/sites/default/files/funding_public_pensions_publish.pdf.
- KyPolicy analysis of comprehensive annual financial reports.
- Infrastructure Investment and Jobs Act, H.R. 3684, 117th Cong. (2021), https://www.congress.gov/bill/117th-congress/house-bill/3684/text.
- The White House, “The Infrastructure Investment and Jobs Act Will Deliver for Kentucky,” https://www.whitehouse.gov/wp-content/uploads/2021/08/KENTUCKY_Infrastructure-Investment-and-Jobs-Act-State-Fact-Sheet.pdf.
- Kentucky Association of Counties, “Federal Infrastructure Bill Signed into Law,” Nov. 17, 2021, https://www.kaco.org/articles/federal-infrastructure-bill-signed-into-law/. Benton Institute for Broadband & Society, “How the Infrastructure and Jobs Act will Make Broadband More Affordable,” Nov. 6, 2021, https://www.benton.org/blog/how-infrastructure-investment-and-jobs-act-will-make-broadband-more-affordable.
- Benton Institute for Broadband & Society, “How the Infrastructure and Jobs Act will Make Broadband More Affordable.”
- Ted Boettner, “Repairing the Damage from Hazardous Abandoned Oil & Gas Wells: A Federal Plan to Grow Jobs in the Ohio River Valley and Beyond,” Ohio River Valley Institute, April 2021, https://ohiorivervalleyinstitute.org/wp-content/uploads/2021/04/Repairing-the-Damage-from-Hazardous-AOG-Wells-Report-1.pdf.
- Kentucky Energy and Environment Cabinet, Kentucky Brownfield Inventory, https://eec.ky.gov/Environmental-Protection/brownfields/Pages/ky-brownfield-inventory.aspx.
- Eric Dixon, “Repairing the Damage: Cleaning up the land, air, and water damaged by the coal industry before 1977,” Ohio River Valley Institute, April 2021, https://reimagineappalachia.org/wp-content/uploads/2021/05/AML-Report-Dixon-ORVI-V1.1-4.pdf. Appalachian Citizens Law Center, “Estimated Distribution of Funds from Infrastructure Investment and Jobs Act for Abandoned Mine Lands,” https://static1.squarespace.com/static/5da75e8578e3be27cc68f60f/t/6112a23938c80e6d2951126f/1628611129508/Est+AML_Funding_Projections+Under+Infrastructure+Investment+and+Jobs+Act+8.10.2021+1.pdf.
- Tracy Nowaczyk, “KYTC Maintenance Needs,” Kentucky Transportation Cabinet, presentation before the Interim Joint Budget Review Subcommittee on Transportation, July 2021, https://apps.legislature.ky.gov/CommitteeDocuments/32/13366/070721-3-KYTC%20Maintenance%20Needs.pdf.
- Brittany Gibson, “Some of the Worst Bridges in the Country Are in Kentucky,” The American Prospect, May 28, 2021, https://prospect.org/infrastructure/building-back-america/some-of-the-worst-bridges-in-the-country-are-in-kentucky/.
- Tracy Nowaczyk, “KYTC Maintenance Needs, Kentucky Transportation Cabinet.”
- The White House, “The Infrastructure Investment and Jobs Act Will Deliver for Kentucky.”
- Bart Jansen, Savannah Behrmann and Ledyard King, “Kentucky, Nation Stand to Gain After House Passes $1.2 Trillion Infrastructure Bill,” USA Today, Nov. 6, 2021, https://www.yahoo.com/lifestyle/kentucky-nation-stand-gain-house-132729792.html.
- Secretary Jim Gray, testimony to the Interim Joint Committee on Transportation, Sept. 20, 2021, https://apps.legislature.ky.gov/CommitteeDocuments/34/13440/9-20-21%20minutes%20.pdf.
- Jansen, Behrmann and King, “Kentucky, Nation Stand to Gain After House Passes $1.2 Trillion Infrastructure Bill.”
- Dustin Pugel, Ashley Spalding, Pam Thomas and Anna Baumann, “Defeating the Pandemic and Building a Robust Recovery: A Preview of the Budget of the Commonwealth,” Kentucky Center for Economic Policy, Dec. 14, 2020, https://kypolicy.org/defeating-the-pandemic-and-building-a-robust-recovery-a-preview-of-the-budget-of-the-commonwealth/.
- Office of State Budget Director, “Commonwealth of Kentucky Quarterly Economic & Review Report Fourth Quarter Fiscal Year 2021.”
- “2019 Report Card for Kentucky’s Infrastructure,” ASCE Kentucky Section, https://infrastructurereportcard.org/wp-content/uploads/2021/07/2019-ASCE-KY-Infrastructure-Report-updated.pdf.
- KICKstartKY, https://www.kickstartky.com/.
- CFG official revenue estimates for the General Fund and Road Fund for FY 2022-2024.
- U.S. Treasury, “Coronavirus State Fiscal Recovery Fund Split Payments to State Governments,” Oct. 25, 2021, https://home.treasury.gov/system/files/136/split-payments-to-states-public1-508A.pdf.
- KyPolicy analysis of Census Household Pulse Survey Data Week 39 for Kentucky, accessed on Dec. 9, 2021, https://www.census.gov/data/tables/2021/demo/hhp/hhp39.html.
- Jason Bailey, “Unprecedented Surplus Presents Opportunity to Both Reinvest in Kentucky’s Budget and Build Rainy Day Fund,” Kentucky Center for Economic Policy, Oct. 20, 2021, https://kypolicy.org/unprecedented-surplus-opportunity-to-reinvest-in-kentucky-budget-and-build-rainy-day-fund/.